Immigrants from South Central Asia 4 or more Vehicles in Household
COMPARE
Immigrants from South Central Asia
Select to Compare
4 or more Vehicles in Household
Immigrants from South Central Asia 4 or more Vehicles in Household
6.1%
4+ VEHICLES AVAILABLE
21.3/ 100
METRIC RATING
202nd/ 347
METRIC RANK
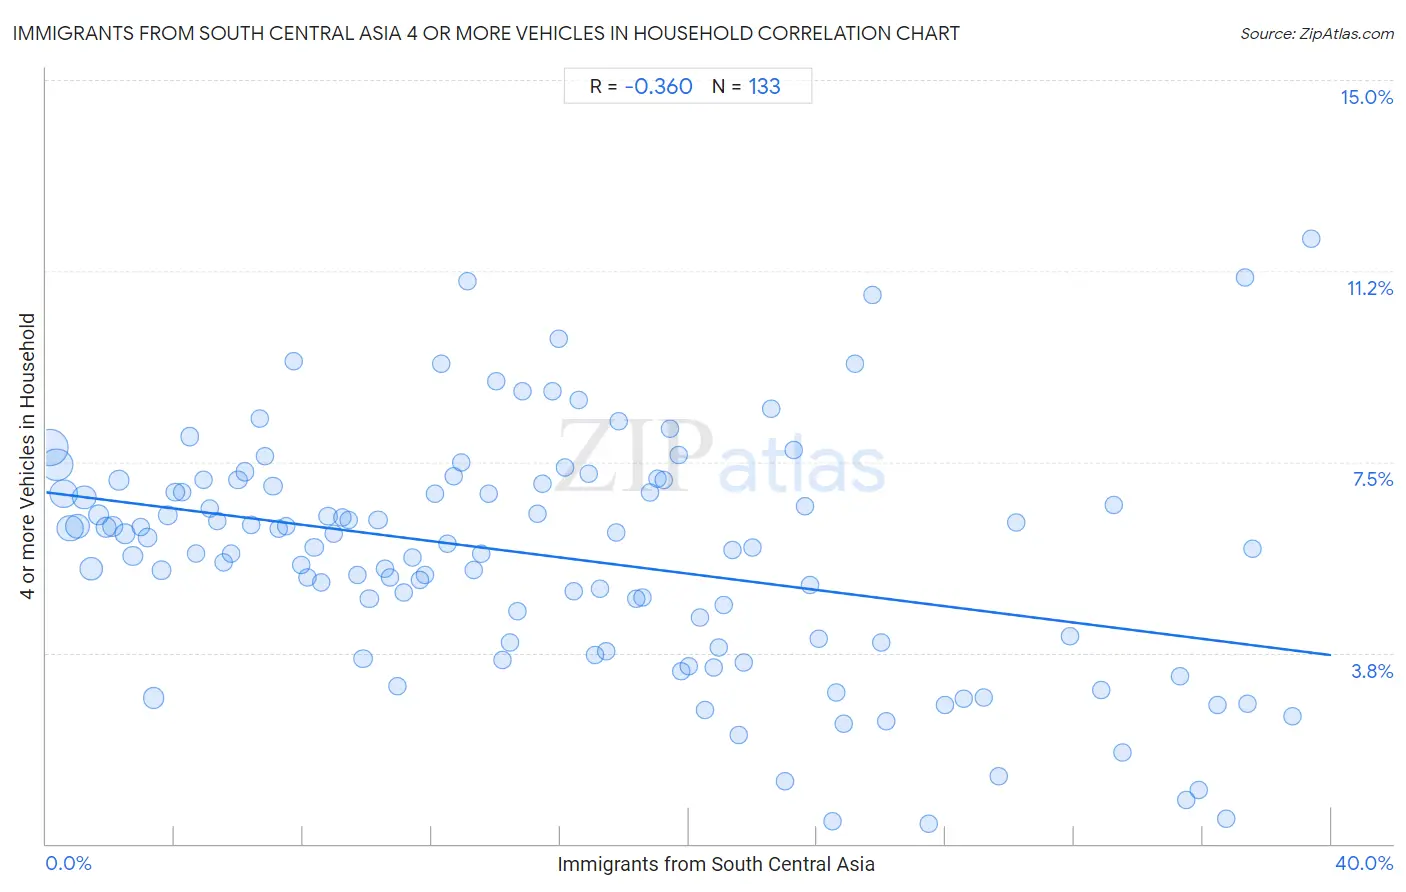
Immigrants from South Central Asia 4 or more Vehicles in Household Correlation Chart
The statistical analysis conducted on geographies consisting of 470,551,958 people shows a mild negative correlation between the proportion of Immigrants from South Central Asia and percentage of households with 4 or more vehicles available in the United States with a correlation coefficient (R) of -0.360 and weighted average of 6.1%. On average, for every 1% (one percent) increase in Immigrants from South Central Asia within a typical geography, there is a decrease of 0.080% in percentage of households with 4 or more vehicles available.
It is essential to understand that the correlation between the percentage of Immigrants from South Central Asia and percentage of households with 4 or more vehicles available does not imply a direct cause-and-effect relationship. It remains uncertain whether the presence of Immigrants from South Central Asia influences an upward or downward trend in the level of percentage of households with 4 or more vehicles available within an area, or if Immigrants from South Central Asia simply ended up residing in those areas with higher or lower levels of percentage of households with 4 or more vehicles available due to other factors.
Demographics Similar to Immigrants from South Central Asia by 4 or more Vehicles in Household
In terms of 4 or more vehicles in household, the demographic groups most similar to Immigrants from South Central Asia are Egyptian (6.1%, a difference of 0.010%), Latvian (6.1%, a difference of 0.060%), Immigrants from Norway (6.1%, a difference of 0.070%), Immigrants from Sierra Leone (6.1%, a difference of 0.14%), and Immigrants from Portugal (6.1%, a difference of 0.15%).
| Demographics | Rating | Rank | 4 or more Vehicles in Household |
| Argentineans | 27.0 /100 | #195 | Fair 6.2% |
| Tsimshian | 26.4 /100 | #196 | Fair 6.2% |
| Immigrants from Sri Lanka | 23.7 /100 | #197 | Fair 6.1% |
| Immigrants from Portugal | 22.3 /100 | #198 | Fair 6.1% |
| Immigrants from Norway | 21.8 /100 | #199 | Fair 6.1% |
| Latvians | 21.7 /100 | #200 | Fair 6.1% |
| Egyptians | 21.4 /100 | #201 | Fair 6.1% |
| Immigrants from South Central Asia | 21.3 /100 | #202 | Fair 6.1% |
| Immigrants from Sierra Leone | 20.5 /100 | #203 | Fair 6.1% |
| Immigrants from Belize | 19.8 /100 | #204 | Poor 6.1% |
| Hondurans | 19.3 /100 | #205 | Poor 6.1% |
| Kenyans | 18.5 /100 | #206 | Poor 6.1% |
| Immigrants from Chile | 16.9 /100 | #207 | Poor 6.1% |
| Immigrants from Nigeria | 15.6 /100 | #208 | Poor 6.1% |
| Immigrants from Honduras | 15.4 /100 | #209 | Poor 6.1% |
Immigrants from South Central Asia 4 or more Vehicles in Household Correlation Summary
| Measurement | Immigrants from South Central Asia Data | 4 or more Vehicles in Household Data |
| Minimum | 0.11% | 0.38% |
| Maximum | 39.4% | 11.9% |
| Range | 39.3% | 11.5% |
| Mean | 15.7% | 5.6% |
| Median | 14.4% | 5.8% |
| Interquartile 25% (IQ1) | 7.2% | 4.0% |
| Interquartile 75% (IQ3) | 22.3% | 7.0% |
| Interquartile Range (IQR) | 15.1% | 3.1% |
| Standard Deviation (Sample) | 10.3% | 2.3% |
| Standard Deviation (Population) | 10.3% | 2.3% |
Correlation Details
| Immigrants from South Central Asia Percentile | Sample Size | 4 or more Vehicles in Household |
[ 0.0% - 0.5% ] 0.11% | 90,193,639 | 7.8% |
[ 0.0% - 0.5% ] 0.32% | 68,583,224 | 7.4% |
[ 0.5% - 1.0% ] 0.54% | 48,634,263 | 6.9% |
[ 0.5% - 1.0% ] 0.76% | 41,004,689 | 6.2% |
[ 0.5% - 1.0% ] 0.97% | 29,904,858 | 6.2% |
[ 1.0% - 1.5% ] 1.18% | 24,968,970 | 6.8% |
[ 1.0% - 1.5% ] 1.41% | 24,076,372 | 5.4% |
[ 1.5% - 2.0% ] 1.63% | 12,973,249 | 6.4% |
[ 1.5% - 2.0% ] 1.85% | 13,752,589 | 6.2% |
[ 2.0% - 2.5% ] 2.06% | 10,237,236 | 6.2% |
[ 2.0% - 2.5% ] 2.27% | 9,884,496 | 7.1% |
[ 2.0% - 2.5% ] 2.45% | 11,751,661 | 6.1% |
[ 2.5% - 3.0% ] 2.70% | 8,783,134 | 5.7% |
[ 2.5% - 3.0% ] 2.94% | 4,589,241 | 6.2% |
[ 3.0% - 3.5% ] 3.15% | 5,787,605 | 6.0% |
[ 3.0% - 3.5% ] 3.34% | 13,198,143 | 2.9% |
[ 3.5% - 4.0% ] 3.58% | 3,852,236 | 5.4% |
[ 3.5% - 4.0% ] 3.79% | 3,233,948 | 6.4% |
[ 4.0% - 4.5% ] 4.01% | 3,171,334 | 6.9% |
[ 4.0% - 4.5% ] 4.22% | 3,496,836 | 6.9% |
[ 4.0% - 4.5% ] 4.46% | 2,517,263 | 8.0% |
[ 4.5% - 5.0% ] 4.65% | 2,012,754 | 5.7% |
[ 4.5% - 5.0% ] 4.89% | 1,948,356 | 7.2% |
[ 5.0% - 5.5% ] 5.09% | 2,216,907 | 6.6% |
[ 5.0% - 5.5% ] 5.32% | 1,873,298 | 6.3% |
[ 5.5% - 6.0% ] 5.53% | 1,183,888 | 5.5% |
[ 5.5% - 6.0% ] 5.75% | 1,398,005 | 5.7% |
[ 5.5% - 6.0% ] 5.97% | 1,345,046 | 7.1% |
[ 6.0% - 6.5% ] 6.19% | 1,053,852 | 7.3% |
[ 6.0% - 6.5% ] 6.37% | 735,197 | 6.3% |
[ 6.5% - 7.0% ] 6.64% | 1,860,757 | 8.4% |
[ 6.5% - 7.0% ] 6.82% | 744,706 | 7.6% |
[ 7.0% - 7.5% ] 7.06% | 771,714 | 7.0% |
[ 7.0% - 7.5% ] 7.24% | 484,868 | 6.2% |
[ 7.0% - 7.5% ] 7.48% | 599,354 | 6.2% |
[ 7.5% - 8.0% ] 7.69% | 550,916 | 9.5% |
[ 7.5% - 8.0% ] 7.94% | 554,475 | 5.5% |
[ 8.0% - 8.5% ] 8.13% | 391,972 | 5.2% |
[ 8.0% - 8.5% ] 8.34% | 1,170,614 | 5.8% |
[ 8.5% - 9.0% ] 8.55% | 831,629 | 5.1% |
[ 8.5% - 9.0% ] 8.77% | 729,360 | 6.4% |
[ 8.5% - 9.0% ] 8.96% | 410,899 | 6.1% |
[ 9.0% - 9.5% ] 9.22% | 689,711 | 6.4% |
[ 9.0% - 9.5% ] 9.41% | 356,155 | 6.4% |
[ 9.5% - 10.0% ] 9.67% | 556,611 | 5.3% |
[ 9.5% - 10.0% ] 9.86% | 413,634 | 3.6% |
[ 10.0% - 10.5% ] 10.06% | 516,387 | 4.8% |
[ 10.0% - 10.5% ] 10.33% | 806,223 | 6.4% |
[ 10.5% - 11.0% ] 10.53% | 315,843 | 5.4% |
[ 10.5% - 11.0% ] 10.72% | 178,081 | 5.2% |
[ 10.5% - 11.0% ] 10.92% | 616,020 | 3.1% |
[ 11.0% - 11.5% ] 11.14% | 163,662 | 4.9% |
[ 11.0% - 11.5% ] 11.40% | 162,669 | 5.6% |
[ 11.5% - 12.0% ] 11.62% | 619,845 | 5.2% |
[ 11.5% - 12.0% ] 11.79% | 526,869 | 5.3% |
[ 12.0% - 12.5% ] 12.09% | 258,290 | 6.9% |
[ 12.0% - 12.5% ] 12.29% | 269,322 | 9.4% |
[ 12.0% - 12.5% ] 12.48% | 474,103 | 5.9% |
[ 12.5% - 13.0% ] 12.67% | 251,228 | 7.2% |
[ 12.5% - 13.0% ] 12.93% | 186,706 | 7.5% |
[ 13.0% - 13.5% ] 13.12% | 182,626 | 11.0% |
[ 13.0% - 13.5% ] 13.30% | 221,278 | 5.4% |
[ 13.5% - 14.0% ] 13.55% | 181,618 | 5.7% |
[ 13.5% - 14.0% ] 13.77% | 413,247 | 6.9% |
[ 13.5% - 14.0% ] 14.00% | 50,575 | 9.1% |
[ 14.0% - 14.5% ] 14.20% | 63,390 | 3.6% |
[ 14.0% - 14.5% ] 14.44% | 138,426 | 4.0% |
[ 14.5% - 15.0% ] 14.66% | 312,359 | 4.6% |
[ 14.5% - 15.0% ] 14.82% | 61,495 | 8.9% |
[ 15.0% - 15.5% ] 15.29% | 84,118 | 6.5% |
[ 15.0% - 15.5% ] 15.45% | 263,005 | 7.1% |
[ 15.5% - 16.0% ] 15.74% | 155,069 | 8.9% |
[ 15.5% - 16.0% ] 15.94% | 132,103 | 9.9% |
[ 16.0% - 16.5% ] 16.16% | 254,593 | 7.4% |
[ 16.0% - 16.5% ] 16.42% | 112,519 | 5.0% |
[ 16.5% - 17.0% ] 16.56% | 113,686 | 8.7% |
[ 16.5% - 17.0% ] 16.89% | 180,117 | 7.3% |
[ 17.0% - 17.5% ] 17.08% | 22,030 | 3.7% |
[ 17.0% - 17.5% ] 17.23% | 272,834 | 5.0% |
[ 17.0% - 17.5% ] 17.44% | 16,679 | 3.8% |
[ 17.5% - 18.0% ] 17.73% | 213,088 | 6.1% |
[ 17.5% - 18.0% ] 17.83% | 131,679 | 8.3% |
[ 18.0% - 18.5% ] 18.37% | 6,272 | 4.8% |
[ 18.5% - 19.0% ] 18.57% | 30,578 | 4.8% |
[ 18.5% - 19.0% ] 18.81% | 152,921 | 6.9% |
[ 19.0% - 19.5% ] 19.03% | 129,604 | 7.2% |
[ 19.0% - 19.5% ] 19.20% | 149,814 | 7.1% |
[ 19.0% - 19.5% ] 19.42% | 11,603 | 8.2% |
[ 19.5% - 20.0% ] 19.69% | 13,297 | 7.6% |
[ 19.5% - 20.0% ] 19.77% | 19,017 | 3.4% |
[ 20.0% - 20.5% ] 20.00% | 49,758 | 3.5% |
[ 20.0% - 20.5% ] 20.33% | 22,831 | 4.5% |
[ 20.5% - 21.0% ] 20.51% | 68,761 | 2.6% |
[ 20.5% - 21.0% ] 20.77% | 33,513 | 3.5% |
[ 20.5% - 21.0% ] 20.92% | 14,067 | 3.9% |
[ 21.0% - 21.5% ] 21.09% | 127,930 | 4.7% |
[ 21.0% - 21.5% ] 21.36% | 210,788 | 5.8% |
[ 21.5% - 22.0% ] 21.54% | 1,207 | 2.1% |
[ 21.5% - 22.0% ] 21.72% | 24,229 | 3.5% |
[ 21.5% - 22.0% ] 21.98% | 74,839 | 5.8% |
[ 22.5% - 23.0% ] 22.57% | 228,795 | 8.5% |
[ 22.5% - 23.0% ] 23.00% | 64,268 | 1.2% |
[ 23.0% - 23.5% ] 23.28% | 37,671 | 7.7% |
[ 23.5% - 24.0% ] 23.60% | 88,402 | 6.6% |
[ 23.5% - 24.0% ] 23.79% | 50,125 | 5.1% |
[ 24.0% - 24.5% ] 24.06% | 22,796 | 4.0% |
[ 24.0% - 24.5% ] 24.46% | 5,491 | 0.44% |
[ 24.5% - 25.0% ] 24.58% | 38,567 | 3.0% |
[ 24.5% - 25.0% ] 24.81% | 37,194 | 2.4% |
[ 25.0% - 25.5% ] 25.19% | 53,464 | 9.4% |
[ 25.5% - 26.0% ] 25.72% | 5,206 | 10.8% |
[ 25.5% - 26.0% ] 25.98% | 42,760 | 3.9% |
[ 26.0% - 26.5% ] 26.16% | 44,127 | 2.4% |
[ 27.0% - 27.5% ] 27.46% | 5,018 | 0.38% |
[ 27.5% - 28.0% ] 27.96% | 15,702 | 2.7% |
[ 28.5% - 29.0% ] 28.55% | 802 | 2.9% |
[ 29.0% - 29.5% ] 29.17% | 3,695 | 2.9% |
[ 29.5% - 30.0% ] 29.66% | 5,867 | 1.3% |
[ 30.0% - 30.5% ] 30.21% | 18,068 | 6.3% |
[ 31.5% - 32.0% ] 31.85% | 16,722 | 4.1% |
[ 32.5% - 33.0% ] 32.84% | 341 | 3.0% |
[ 33.0% - 33.5% ] 33.22% | 20,264 | 6.7% |
[ 33.5% - 34.0% ] 33.51% | 37,689 | 1.8% |
[ 35.0% - 35.5% ] 35.30% | 1,425 | 3.3% |
[ 35.0% - 35.5% ] 35.50% | 20,693 | 0.86% |
[ 35.5% - 36.0% ] 35.86% | 15,585 | 1.1% |
[ 36.0% - 36.5% ] 36.48% | 2,300 | 2.7% |
[ 36.5% - 37.0% ] 36.72% | 1,999 | 0.50% |
[ 37.0% - 37.5% ] 37.30% | 2,241 | 11.1% |
[ 37.0% - 37.5% ] 37.40% | 44,570 | 2.7% |
[ 37.5% - 38.0% ] 37.56% | 39,565 | 5.8% |
[ 38.5% - 39.0% ] 38.78% | 37,022 | 2.5% |
[ 39.0% - 39.5% ] 39.37% | 1,049 | 11.9% |