Immigrants from South Central Asia Self-Care Disability
COMPARE
Immigrants from South Central Asia
Select to Compare
Self-Care Disability
Immigrants from South Central Asia Self-Care Disability
2.2%
SELF-CARE DISABILITY
100.0/ 100
METRIC RATING
11th/ 347
METRIC RANK
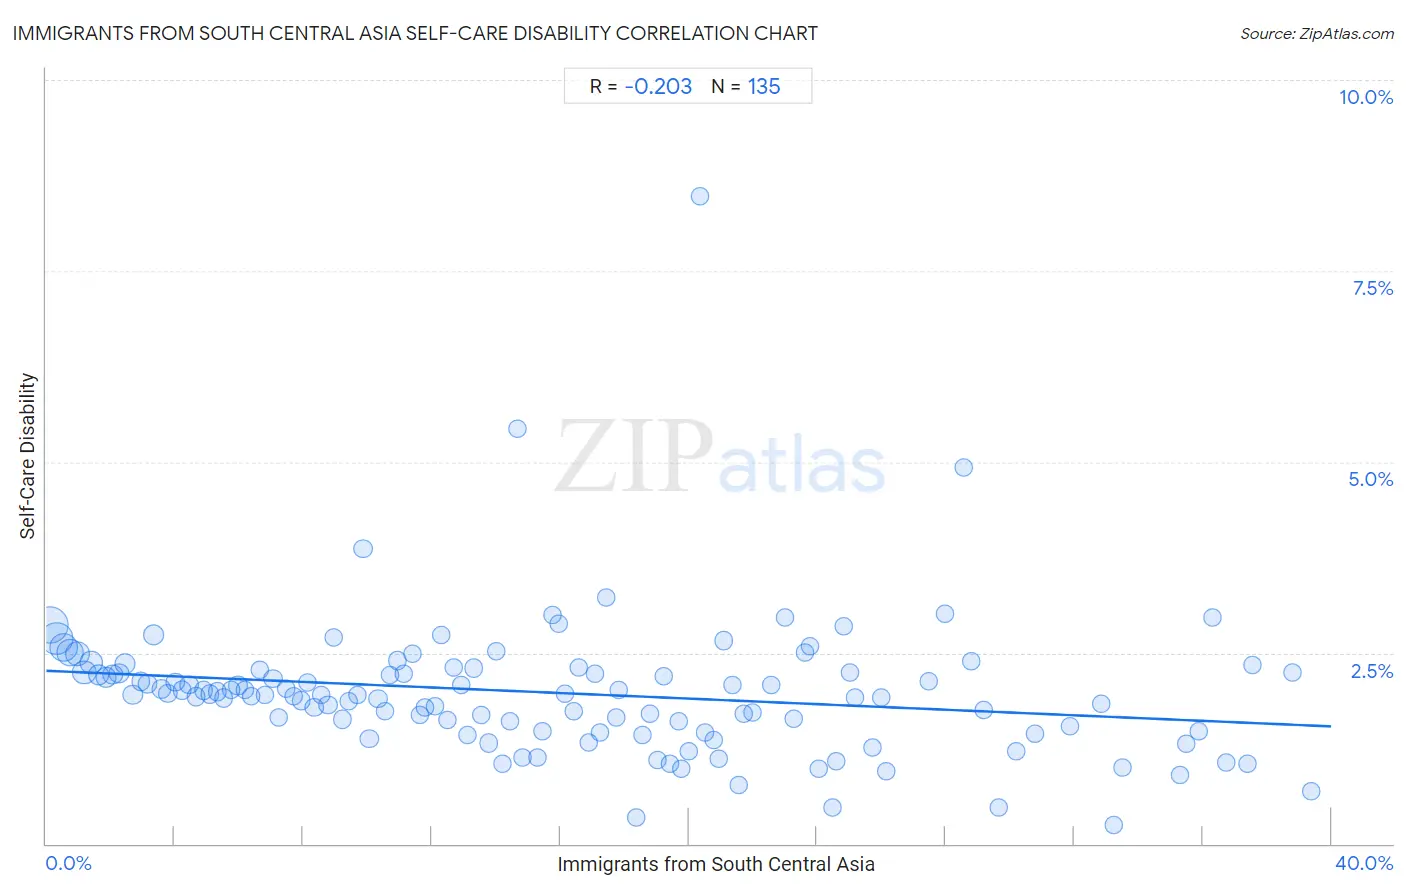
Immigrants from South Central Asia Self-Care Disability Correlation Chart
The statistical analysis conducted on geographies consisting of 472,250,690 people shows a weak negative correlation between the proportion of Immigrants from South Central Asia and percentage of population with self-care disability in the United States with a correlation coefficient (R) of -0.203 and weighted average of 2.2%. On average, for every 1% (one percent) increase in Immigrants from South Central Asia within a typical geography, there is a decrease of 0.018% in percentage of population with self-care disability.
It is essential to understand that the correlation between the percentage of Immigrants from South Central Asia and percentage of population with self-care disability does not imply a direct cause-and-effect relationship. It remains uncertain whether the presence of Immigrants from South Central Asia influences an upward or downward trend in the level of percentage of population with self-care disability within an area, or if Immigrants from South Central Asia simply ended up residing in those areas with higher or lower levels of percentage of population with self-care disability due to other factors.
Demographics Similar to Immigrants from South Central Asia by Self-Care Disability
In terms of self-care disability, the demographic groups most similar to Immigrants from South Central Asia are Immigrants from Ethiopia (2.2%, a difference of 0.050%), Ethiopian (2.2%, a difference of 0.070%), Sudanese (2.2%, a difference of 0.10%), Luxembourger (2.2%, a difference of 0.23%), and Okinawan (2.2%, a difference of 0.23%).
| Demographics | Rating | Rank | Self-Care Disability |
| Immigrants from Singapore | 100.0 /100 | #4 | Exceptional 2.1% |
| Zimbabweans | 100.0 /100 | #5 | Exceptional 2.2% |
| Filipinos | 100.0 /100 | #6 | Exceptional 2.2% |
| Immigrants from Bolivia | 100.0 /100 | #7 | Exceptional 2.2% |
| Bolivians | 100.0 /100 | #8 | Exceptional 2.2% |
| Immigrants from Nepal | 100.0 /100 | #9 | Exceptional 2.2% |
| Sudanese | 100.0 /100 | #10 | Exceptional 2.2% |
| Immigrants from South Central Asia | 100.0 /100 | #11 | Exceptional 2.2% |
| Immigrants from Ethiopia | 100.0 /100 | #12 | Exceptional 2.2% |
| Ethiopians | 100.0 /100 | #13 | Exceptional 2.2% |
| Luxembourgers | 100.0 /100 | #14 | Exceptional 2.2% |
| Okinawans | 100.0 /100 | #15 | Exceptional 2.2% |
| Immigrants from Kuwait | 100.0 /100 | #16 | Exceptional 2.2% |
| Immigrants from Saudi Arabia | 100.0 /100 | #17 | Exceptional 2.2% |
| Immigrants from Taiwan | 100.0 /100 | #18 | Exceptional 2.2% |
Immigrants from South Central Asia Self-Care Disability Correlation Summary
| Measurement | Immigrants from South Central Asia Data | Self-Care Disability Data |
| Minimum | 0.11% | 0.25% |
| Maximum | 39.4% | 8.5% |
| Range | 39.3% | 8.2% |
| Mean | 15.8% | 2.0% |
| Median | 14.7% | 1.9% |
| Interquartile 25% (IQ1) | 7.2% | 1.5% |
| Interquartile 75% (IQ3) | 23.0% | 2.2% |
| Interquartile Range (IQR) | 15.8% | 0.78% |
| Standard Deviation (Sample) | 10.3% | 0.92% |
| Standard Deviation (Population) | 10.2% | 0.92% |
Correlation Details
| Immigrants from South Central Asia Percentile | Sample Size | Self-Care Disability |
[ 0.0% - 0.5% ] 0.11% | 90,333,211 | 2.9% |
[ 0.0% - 0.5% ] 0.32% | 68,649,502 | 2.7% |
[ 0.5% - 1.0% ] 0.54% | 49,003,397 | 2.6% |
[ 0.5% - 1.0% ] 0.76% | 41,204,418 | 2.5% |
[ 0.5% - 1.0% ] 0.97% | 30,024,375 | 2.5% |
[ 1.0% - 1.5% ] 1.18% | 25,054,041 | 2.2% |
[ 1.0% - 1.5% ] 1.41% | 24,177,789 | 2.4% |
[ 1.5% - 2.0% ] 1.63% | 13,011,828 | 2.2% |
[ 1.5% - 2.0% ] 1.85% | 13,778,485 | 2.2% |
[ 2.0% - 2.5% ] 2.06% | 10,299,767 | 2.2% |
[ 2.0% - 2.5% ] 2.27% | 9,888,361 | 2.2% |
[ 2.0% - 2.5% ] 2.45% | 11,747,656 | 2.4% |
[ 2.5% - 3.0% ] 2.70% | 8,788,996 | 1.9% |
[ 2.5% - 3.0% ] 2.94% | 4,626,793 | 2.1% |
[ 3.0% - 3.5% ] 3.15% | 5,802,975 | 2.1% |
[ 3.0% - 3.5% ] 3.34% | 13,228,094 | 2.7% |
[ 3.5% - 4.0% ] 3.58% | 3,925,380 | 2.0% |
[ 3.5% - 4.0% ] 3.79% | 3,271,390 | 2.0% |
[ 4.0% - 4.5% ] 4.01% | 3,212,982 | 2.1% |
[ 4.0% - 4.5% ] 4.22% | 3,500,608 | 2.0% |
[ 4.0% - 4.5% ] 4.45% | 2,575,496 | 2.1% |
[ 4.5% - 5.0% ] 4.65% | 2,017,696 | 1.9% |
[ 4.5% - 5.0% ] 4.89% | 1,951,749 | 2.0% |
[ 5.0% - 5.5% ] 5.09% | 2,222,911 | 2.0% |
[ 5.0% - 5.5% ] 5.32% | 1,893,872 | 2.0% |
[ 5.5% - 6.0% ] 5.53% | 1,184,600 | 1.9% |
[ 5.5% - 6.0% ] 5.75% | 1,423,418 | 2.0% |
[ 5.5% - 6.0% ] 5.97% | 1,354,176 | 2.1% |
[ 6.0% - 6.5% ] 6.19% | 1,060,282 | 2.0% |
[ 6.0% - 6.5% ] 6.37% | 734,874 | 1.9% |
[ 6.5% - 7.0% ] 6.64% | 1,860,777 | 2.3% |
[ 6.5% - 7.0% ] 6.82% | 754,575 | 1.9% |
[ 7.0% - 7.5% ] 7.06% | 787,421 | 2.2% |
[ 7.0% - 7.5% ] 7.24% | 486,037 | 1.7% |
[ 7.0% - 7.5% ] 7.48% | 606,174 | 2.0% |
[ 7.5% - 8.0% ] 7.69% | 562,429 | 1.9% |
[ 7.5% - 8.0% ] 7.94% | 553,048 | 1.9% |
[ 8.0% - 8.5% ] 8.13% | 395,200 | 2.1% |
[ 8.0% - 8.5% ] 8.34% | 1,170,614 | 1.8% |
[ 8.5% - 9.0% ] 8.55% | 831,548 | 1.9% |
[ 8.5% - 9.0% ] 8.77% | 724,055 | 1.8% |
[ 8.5% - 9.0% ] 8.96% | 417,924 | 2.7% |
[ 9.0% - 9.5% ] 9.22% | 718,432 | 1.6% |
[ 9.0% - 9.5% ] 9.41% | 360,378 | 1.9% |
[ 9.5% - 10.0% ] 9.67% | 556,611 | 1.9% |
[ 9.5% - 10.0% ] 9.86% | 414,572 | 3.9% |
[ 10.0% - 10.5% ] 10.06% | 516,387 | 1.4% |
[ 10.0% - 10.5% ] 10.33% | 806,876 | 1.9% |
[ 10.5% - 11.0% ] 10.53% | 315,843 | 1.7% |
[ 10.5% - 11.0% ] 10.72% | 178,081 | 2.2% |
[ 10.5% - 11.0% ] 10.92% | 616,482 | 2.4% |
[ 11.0% - 11.5% ] 11.14% | 163,662 | 2.2% |
[ 11.0% - 11.5% ] 11.40% | 162,669 | 2.5% |
[ 11.5% - 12.0% ] 11.62% | 618,620 | 1.7% |
[ 11.5% - 12.0% ] 11.79% | 531,443 | 1.8% |
[ 12.0% - 12.5% ] 12.09% | 254,613 | 1.8% |
[ 12.0% - 12.5% ] 12.29% | 269,322 | 2.7% |
[ 12.0% - 12.5% ] 12.48% | 474,103 | 1.6% |
[ 12.5% - 13.0% ] 12.67% | 251,228 | 2.3% |
[ 12.5% - 13.0% ] 12.93% | 186,675 | 2.1% |
[ 13.0% - 13.5% ] 13.12% | 182,626 | 1.4% |
[ 13.0% - 13.5% ] 13.30% | 221,901 | 2.3% |
[ 13.5% - 14.0% ] 13.55% | 181,618 | 1.7% |
[ 13.5% - 14.0% ] 13.77% | 413,804 | 1.3% |
[ 13.5% - 14.0% ] 14.00% | 50,575 | 2.5% |
[ 14.0% - 14.5% ] 14.20% | 65,199 | 1.1% |
[ 14.0% - 14.5% ] 14.44% | 134,788 | 1.6% |
[ 14.5% - 15.0% ] 14.66% | 332,921 | 5.4% |
[ 14.5% - 15.0% ] 14.82% | 63,656 | 1.1% |
[ 15.0% - 15.5% ] 15.29% | 84,118 | 1.1% |
[ 15.0% - 15.5% ] 15.45% | 261,372 | 1.5% |
[ 15.5% - 16.0% ] 15.74% | 157,488 | 3.0% |
[ 15.5% - 16.0% ] 15.94% | 131,959 | 2.9% |
[ 16.0% - 16.5% ] 16.16% | 254,593 | 2.0% |
[ 16.0% - 16.5% ] 16.42% | 112,519 | 1.7% |
[ 16.5% - 17.0% ] 16.56% | 113,686 | 2.3% |
[ 16.5% - 17.0% ] 16.89% | 180,117 | 1.3% |
[ 17.0% - 17.5% ] 17.08% | 22,030 | 2.2% |
[ 17.0% - 17.5% ] 17.23% | 272,834 | 1.5% |
[ 17.0% - 17.5% ] 17.44% | 16,736 | 3.2% |
[ 17.5% - 18.0% ] 17.73% | 215,024 | 1.7% |
[ 17.5% - 18.0% ] 17.83% | 131,679 | 2.0% |
[ 18.0% - 18.5% ] 18.37% | 6,272 | 0.35% |
[ 18.5% - 19.0% ] 18.57% | 29,916 | 1.4% |
[ 18.5% - 19.0% ] 18.81% | 152,702 | 1.7% |
[ 19.0% - 19.5% ] 19.03% | 129,604 | 1.1% |
[ 19.0% - 19.5% ] 19.20% | 149,814 | 2.2% |
[ 19.0% - 19.5% ] 19.42% | 11,603 | 1.0% |
[ 19.5% - 20.0% ] 19.69% | 13,297 | 1.6% |
[ 19.5% - 20.0% ] 19.77% | 21,152 | 0.99% |
[ 20.0% - 20.5% ] 20.01% | 51,902 | 1.2% |
[ 20.0% - 20.5% ] 20.33% | 22,831 | 8.5% |
[ 20.5% - 21.0% ] 20.51% | 68,761 | 1.4% |
[ 20.5% - 21.0% ] 20.77% | 32,559 | 1.4% |
[ 20.5% - 21.0% ] 20.92% | 14,067 | 1.1% |
[ 21.0% - 21.5% ] 21.09% | 127,930 | 2.7% |
[ 21.0% - 21.5% ] 21.36% | 210,788 | 2.1% |
[ 21.5% - 22.0% ] 21.54% | 1,207 | 0.77% |
[ 21.5% - 22.0% ] 21.72% | 24,229 | 1.7% |
[ 21.5% - 22.0% ] 21.98% | 74,839 | 1.7% |
[ 22.5% - 23.0% ] 22.57% | 228,795 | 2.1% |
[ 22.5% - 23.0% ] 23.00% | 64,268 | 3.0% |
[ 23.0% - 23.5% ] 23.28% | 37,671 | 1.6% |
[ 23.5% - 24.0% ] 23.60% | 88,402 | 2.5% |
[ 23.5% - 24.0% ] 23.79% | 50,125 | 2.6% |
[ 24.0% - 24.5% ] 24.06% | 22,796 | 0.99% |
[ 24.0% - 24.5% ] 24.46% | 8,257 | 0.48% |
[ 24.5% - 25.0% ] 24.58% | 38,567 | 1.1% |
[ 24.5% - 25.0% ] 24.81% | 37,194 | 2.9% |
[ 25.0% - 25.5% ] 25.00% | 312 | 2.2% |
[ 25.0% - 25.5% ] 25.19% | 53,464 | 1.9% |
[ 25.5% - 26.0% ] 25.72% | 5,206 | 1.3% |
[ 25.5% - 26.0% ] 25.98% | 42,903 | 1.9% |
[ 26.0% - 26.5% ] 26.16% | 44,127 | 0.95% |
[ 27.0% - 27.5% ] 27.46% | 5,018 | 2.1% |
[ 27.5% - 28.0% ] 27.96% | 15,702 | 3.0% |
[ 28.5% - 29.0% ] 28.55% | 802 | 4.9% |
[ 28.5% - 29.0% ] 28.80% | 184 | 2.4% |
[ 29.0% - 29.5% ] 29.17% | 3,695 | 1.7% |
[ 29.5% - 30.0% ] 29.66% | 5,867 | 0.47% |
[ 30.0% - 30.5% ] 30.21% | 18,068 | 1.2% |
[ 30.5% - 31.0% ] 30.78% | 2,560 | 1.4% |
[ 31.5% - 32.0% ] 31.85% | 16,722 | 1.5% |
[ 32.5% - 33.0% ] 32.84% | 341 | 1.8% |
[ 33.0% - 33.5% ] 33.22% | 20,264 | 0.25% |
[ 33.5% - 34.0% ] 33.51% | 37,689 | 1.0% |
[ 35.0% - 35.5% ] 35.30% | 1,425 | 0.89% |
[ 35.0% - 35.5% ] 35.50% | 20,693 | 1.3% |
[ 35.5% - 36.0% ] 35.86% | 15,585 | 1.5% |
[ 36.0% - 36.5% ] 36.30% | 146 | 3.0% |
[ 36.5% - 37.0% ] 36.72% | 1,999 | 1.1% |
[ 37.0% - 37.5% ] 37.40% | 44,570 | 1.0% |
[ 37.5% - 38.0% ] 37.56% | 39,565 | 2.3% |
[ 38.5% - 39.0% ] 38.78% | 37,022 | 2.2% |
[ 39.0% - 39.5% ] 39.37% | 1,049 | 0.69% |