Immigrants from South Central Asia Wage/Income Gap
COMPARE
Immigrants from South Central Asia
Select to Compare
Wage/Income Gap
Immigrants from South Central Asia Wage/Income Gap
29.3%
WAGE/INCOME GAP
0.0/ 100
METRIC RATING
332nd/ 347
METRIC RANK
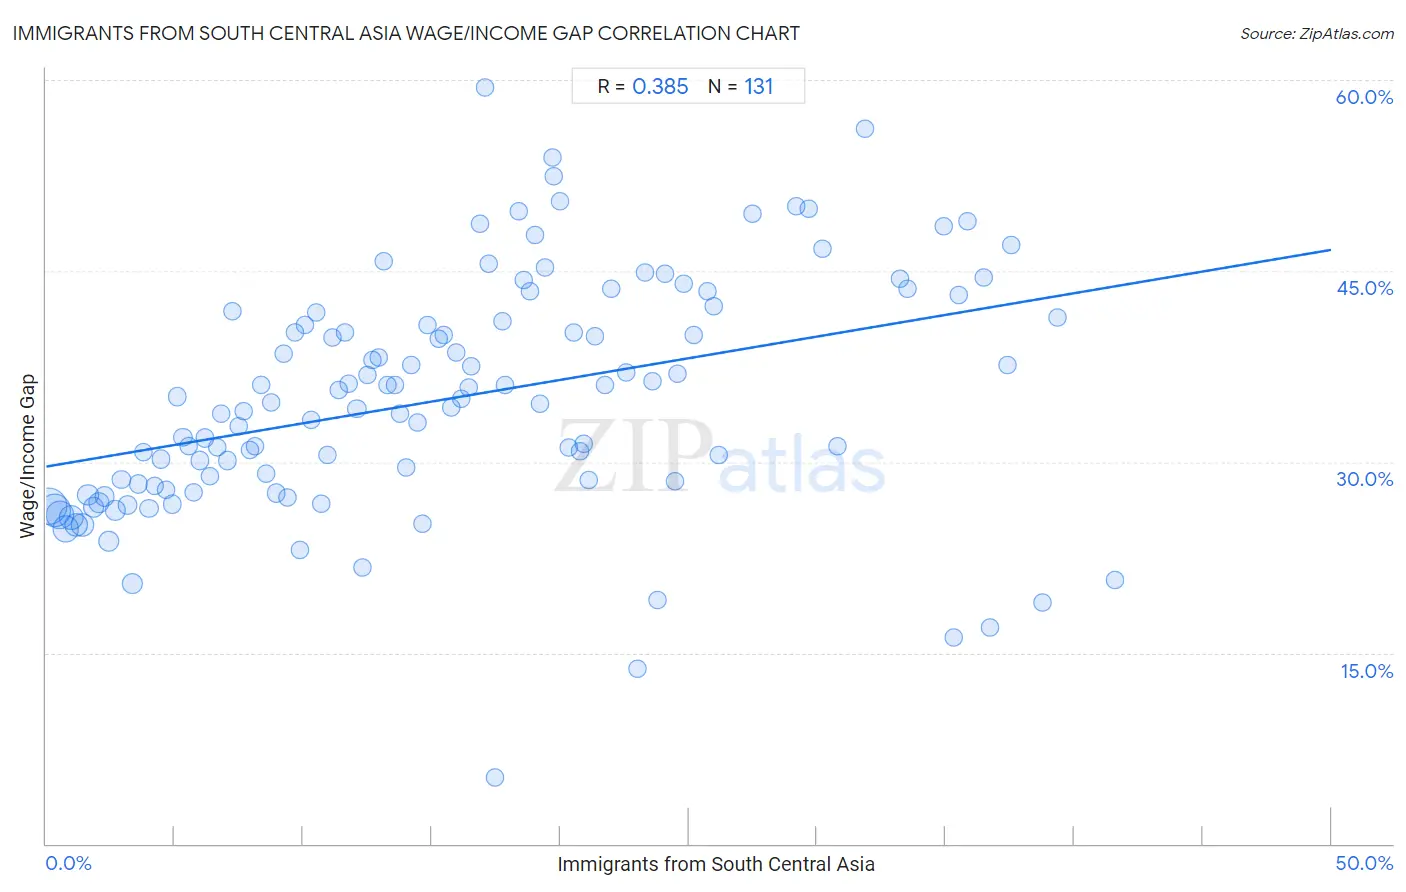
Immigrants from South Central Asia Wage/Income Gap Correlation Chart
The statistical analysis conducted on geographies consisting of 472,660,484 people shows a mild positive correlation between the proportion of Immigrants from South Central Asia and wage/income gap percentage in the United States with a correlation coefficient (R) of 0.385 and weighted average of 29.3%. On average, for every 1% (one percent) increase in Immigrants from South Central Asia within a typical geography, there is an increase of 0.34% in wage/income gap percentage.
It is essential to understand that the correlation between the percentage of Immigrants from South Central Asia and wage/income gap percentage does not imply a direct cause-and-effect relationship. It remains uncertain whether the presence of Immigrants from South Central Asia influences an upward or downward trend in the level of wage/income gap percentage within an area, or if Immigrants from South Central Asia simply ended up residing in those areas with higher or lower levels of wage/income gap percentage due to other factors.
Demographics Similar to Immigrants from South Central Asia by Wage/Income Gap
In terms of wage/income gap, the demographic groups most similar to Immigrants from South Central Asia are European (29.4%, a difference of 0.19%), Swedish (29.4%, a difference of 0.34%), Immigrants from Taiwan (29.5%, a difference of 0.46%), English (29.5%, a difference of 0.47%), and Czech (29.2%, a difference of 0.51%).
| Demographics | Rating | Rank | Wage/Income Gap |
| Hungarians | 0.0 /100 | #325 | Tragic 29.0% |
| Immigrants from Belgium | 0.0 /100 | #326 | Tragic 29.0% |
| Immigrants from Iran | 0.0 /100 | #327 | Tragic 29.1% |
| Scandinavians | 0.0 /100 | #328 | Tragic 29.1% |
| Scottish | 0.0 /100 | #329 | Tragic 29.1% |
| Germans | 0.0 /100 | #330 | Tragic 29.2% |
| Czechs | 0.0 /100 | #331 | Tragic 29.2% |
| Immigrants from South Central Asia | 0.0 /100 | #332 | Tragic 29.3% |
| Europeans | 0.0 /100 | #333 | Tragic 29.4% |
| Swedes | 0.0 /100 | #334 | Tragic 29.4% |
| Immigrants from Taiwan | 0.0 /100 | #335 | Tragic 29.5% |
| English | 0.0 /100 | #336 | Tragic 29.5% |
| Dutch | 0.0 /100 | #337 | Tragic 29.6% |
| Filipinos | 0.0 /100 | #338 | Tragic 29.7% |
| Iranians | 0.0 /100 | #339 | Tragic 29.7% |
Immigrants from South Central Asia Wage/Income Gap Correlation Summary
| Measurement | Immigrants from South Central Asia Data | Wage/Income Gap Data |
| Minimum | 0.11% | 5.2% |
| Maximum | 41.6% | 59.4% |
| Range | 41.5% | 54.2% |
| Mean | 15.6% | 34.9% |
| Median | 14.2% | 34.6% |
| Interquartile 25% (IQ1) | 7.1% | 28.1% |
| Interquartile 75% (IQ3) | 22.0% | 41.3% |
| Interquartile Range (IQR) | 14.9% | 13.2% |
| Standard Deviation (Sample) | 10.5% | 9.3% |
| Standard Deviation (Population) | 10.4% | 9.2% |
Correlation Details
| Immigrants from South Central Asia Percentile | Sample Size | Wage/Income Gap |
[ 0.0% - 0.5% ] 0.11% | 90,397,438 | 26.5% |
[ 0.0% - 0.5% ] 0.32% | 68,733,535 | 26.2% |
[ 0.5% - 1.0% ] 0.54% | 49,025,635 | 25.8% |
[ 0.5% - 1.0% ] 0.76% | 41,201,827 | 24.7% |
[ 0.5% - 1.0% ] 0.97% | 30,086,295 | 25.6% |
[ 1.0% - 1.5% ] 1.18% | 25,057,010 | 25.1% |
[ 1.0% - 1.5% ] 1.41% | 24,197,375 | 25.1% |
[ 1.5% - 2.0% ] 1.63% | 13,034,407 | 27.4% |
[ 1.5% - 2.0% ] 1.85% | 13,791,163 | 26.4% |
[ 2.0% - 2.5% ] 2.06% | 10,310,163 | 26.8% |
[ 2.0% - 2.5% ] 2.27% | 9,914,013 | 27.3% |
[ 2.0% - 2.5% ] 2.45% | 11,784,219 | 23.8% |
[ 2.5% - 3.0% ] 2.70% | 8,786,459 | 26.2% |
[ 2.5% - 3.0% ] 2.94% | 4,628,041 | 28.6% |
[ 3.0% - 3.5% ] 3.15% | 5,814,910 | 26.6% |
[ 3.0% - 3.5% ] 3.34% | 13,238,657 | 20.5% |
[ 3.5% - 4.0% ] 3.58% | 3,930,779 | 28.3% |
[ 3.5% - 4.0% ] 3.79% | 3,273,304 | 30.8% |
[ 4.0% - 4.5% ] 4.01% | 3,222,413 | 26.3% |
[ 4.0% - 4.5% ] 4.22% | 3,511,858 | 28.1% |
[ 4.0% - 4.5% ] 4.45% | 2,573,268 | 30.2% |
[ 4.5% - 5.0% ] 4.65% | 2,018,942 | 27.8% |
[ 4.5% - 5.0% ] 4.89% | 1,951,749 | 26.7% |
[ 5.0% - 5.5% ] 5.09% | 2,221,036 | 35.1% |
[ 5.0% - 5.5% ] 5.32% | 1,892,926 | 31.9% |
[ 5.5% - 6.0% ] 5.53% | 1,183,584 | 31.2% |
[ 5.5% - 6.0% ] 5.75% | 1,433,200 | 27.6% |
[ 5.5% - 6.0% ] 5.97% | 1,356,911 | 30.1% |
[ 6.0% - 6.5% ] 6.19% | 1,060,839 | 31.9% |
[ 6.0% - 6.5% ] 6.37% | 733,632 | 28.8% |
[ 6.5% - 7.0% ] 6.64% | 1,855,718 | 31.2% |
[ 6.5% - 7.0% ] 6.82% | 752,987 | 33.8% |
[ 7.0% - 7.5% ] 7.06% | 788,112 | 30.1% |
[ 7.0% - 7.5% ] 7.24% | 485,831 | 41.8% |
[ 7.0% - 7.5% ] 7.48% | 608,055 | 32.8% |
[ 7.5% - 8.0% ] 7.69% | 564,680 | 33.9% |
[ 7.5% - 8.0% ] 7.94% | 553,048 | 30.9% |
[ 8.0% - 8.5% ] 8.13% | 395,200 | 31.2% |
[ 8.0% - 8.5% ] 8.34% | 1,170,614 | 36.0% |
[ 8.5% - 9.0% ] 8.55% | 830,760 | 29.1% |
[ 8.5% - 9.0% ] 8.77% | 729,360 | 34.6% |
[ 8.5% - 9.0% ] 8.96% | 417,724 | 27.5% |
[ 9.0% - 9.5% ] 9.22% | 717,694 | 38.5% |
[ 9.0% - 9.5% ] 9.41% | 359,042 | 27.2% |
[ 9.5% - 10.0% ] 9.67% | 556,611 | 40.2% |
[ 9.5% - 10.0% ] 9.86% | 413,634 | 23.1% |
[ 10.0% - 10.5% ] 10.06% | 514,349 | 40.7% |
[ 10.0% - 10.5% ] 10.33% | 806,223 | 33.3% |
[ 10.5% - 11.0% ] 10.53% | 315,843 | 41.7% |
[ 10.5% - 11.0% ] 10.72% | 177,785 | 26.7% |
[ 10.5% - 11.0% ] 10.92% | 616,020 | 30.5% |
[ 11.0% - 11.5% ] 11.14% | 163,206 | 39.8% |
[ 11.0% - 11.5% ] 11.40% | 162,669 | 35.6% |
[ 11.5% - 12.0% ] 11.62% | 619,845 | 40.1% |
[ 11.5% - 12.0% ] 11.79% | 531,443 | 36.2% |
[ 12.0% - 12.5% ] 12.09% | 258,290 | 34.2% |
[ 12.0% - 12.5% ] 12.29% | 269,322 | 21.7% |
[ 12.0% - 12.5% ] 12.48% | 474,103 | 36.9% |
[ 12.5% - 13.0% ] 12.67% | 251,228 | 38.0% |
[ 12.5% - 13.0% ] 12.93% | 186,675 | 38.2% |
[ 13.0% - 13.5% ] 13.12% | 182,626 | 45.7% |
[ 13.0% - 13.5% ] 13.30% | 221,901 | 36.0% |
[ 13.5% - 14.0% ] 13.55% | 181,618 | 36.0% |
[ 13.5% - 14.0% ] 13.77% | 413,015 | 33.8% |
[ 13.5% - 14.0% ] 14.00% | 50,575 | 29.5% |
[ 14.0% - 14.5% ] 14.20% | 66,743 | 37.6% |
[ 14.0% - 14.5% ] 14.44% | 138,426 | 33.1% |
[ 14.5% - 15.0% ] 14.66% | 332,921 | 25.2% |
[ 14.5% - 15.0% ] 14.82% | 63,656 | 40.7% |
[ 15.0% - 15.5% ] 15.29% | 84,118 | 39.7% |
[ 15.0% - 15.5% ] 15.45% | 263,005 | 40.0% |
[ 15.5% - 16.0% ] 15.74% | 159,820 | 34.3% |
[ 15.5% - 16.0% ] 15.94% | 132,103 | 38.6% |
[ 16.0% - 16.5% ] 16.16% | 254,248 | 34.9% |
[ 16.0% - 16.5% ] 16.42% | 112,519 | 35.9% |
[ 16.5% - 17.0% ] 16.56% | 113,686 | 37.5% |
[ 16.5% - 17.0% ] 16.89% | 180,117 | 48.7% |
[ 17.0% - 17.5% ] 17.08% | 22,030 | 59.4% |
[ 17.0% - 17.5% ] 17.23% | 272,834 | 45.5% |
[ 17.0% - 17.5% ] 17.44% | 16,679 | 5.2% |
[ 17.5% - 18.0% ] 17.73% | 215,024 | 41.1% |
[ 17.5% - 18.0% ] 17.83% | 131,679 | 36.1% |
[ 18.0% - 18.5% ] 18.37% | 6,272 | 49.6% |
[ 18.5% - 19.0% ] 18.57% | 29,916 | 44.3% |
[ 18.5% - 19.0% ] 18.81% | 152,702 | 43.4% |
[ 19.0% - 19.5% ] 19.03% | 129,604 | 47.8% |
[ 19.0% - 19.5% ] 19.20% | 149,814 | 34.6% |
[ 19.0% - 19.5% ] 19.42% | 11,603 | 45.3% |
[ 19.5% - 20.0% ] 19.69% | 13,297 | 53.9% |
[ 19.5% - 20.0% ] 19.77% | 21,152 | 52.4% |
[ 20.0% - 20.5% ] 20.00% | 49,758 | 50.5% |
[ 20.0% - 20.5% ] 20.33% | 22,831 | 31.2% |
[ 20.5% - 21.0% ] 20.51% | 68,761 | 40.1% |
[ 20.5% - 21.0% ] 20.77% | 33,513 | 30.8% |
[ 20.5% - 21.0% ] 20.92% | 14,067 | 31.5% |
[ 21.0% - 21.5% ] 21.09% | 127,930 | 28.6% |
[ 21.0% - 21.5% ] 21.36% | 210,788 | 39.9% |
[ 21.5% - 22.0% ] 21.72% | 24,229 | 36.0% |
[ 21.5% - 22.0% ] 21.98% | 74,839 | 43.6% |
[ 22.5% - 23.0% ] 22.57% | 228,795 | 37.0% |
[ 22.5% - 23.0% ] 23.00% | 64,268 | 13.8% |
[ 23.0% - 23.5% ] 23.28% | 37,671 | 44.9% |
[ 23.5% - 24.0% ] 23.60% | 88,402 | 36.3% |
[ 23.5% - 24.0% ] 23.79% | 50,125 | 19.1% |
[ 24.0% - 24.5% ] 24.06% | 22,796 | 44.8% |
[ 24.0% - 24.5% ] 24.46% | 8,257 | 28.5% |
[ 24.5% - 25.0% ] 24.58% | 38,567 | 36.9% |
[ 24.5% - 25.0% ] 24.81% | 36,595 | 44.0% |
[ 25.0% - 25.5% ] 25.19% | 53,464 | 40.0% |
[ 25.5% - 26.0% ] 25.72% | 5,206 | 43.4% |
[ 25.5% - 26.0% ] 25.98% | 42,760 | 42.2% |
[ 26.0% - 26.5% ] 26.16% | 44,127 | 30.6% |
[ 27.0% - 27.5% ] 27.46% | 5,018 | 49.5% |
[ 29.0% - 29.5% ] 29.17% | 3,695 | 50.1% |
[ 29.5% - 30.0% ] 29.66% | 5,867 | 49.9% |
[ 30.0% - 30.5% ] 30.21% | 18,068 | 46.8% |
[ 30.5% - 31.0% ] 30.78% | 2,560 | 31.3% |
[ 31.5% - 32.0% ] 31.85% | 16,722 | 56.2% |
[ 33.0% - 33.5% ] 33.22% | 20,264 | 44.4% |
[ 33.5% - 34.0% ] 33.51% | 37,689 | 43.6% |
[ 34.5% - 35.0% ] 34.92% | 733 | 48.5% |
[ 35.0% - 35.5% ] 35.30% | 1,425 | 16.2% |
[ 35.0% - 35.5% ] 35.50% | 20,693 | 43.1% |
[ 35.5% - 36.0% ] 35.86% | 15,585 | 48.9% |
[ 36.0% - 36.5% ] 36.48% | 2,300 | 44.5% |
[ 36.5% - 37.0% ] 36.72% | 1,999 | 17.0% |
[ 37.0% - 37.5% ] 37.40% | 44,570 | 37.6% |
[ 37.5% - 38.0% ] 37.56% | 39,565 | 47.0% |
[ 38.5% - 39.0% ] 38.78% | 37,022 | 18.9% |
[ 39.0% - 39.5% ] 39.37% | 1,049 | 41.3% |
[ 41.5% - 42.0% ] 41.58% | 2,549 | 20.7% |