Immigrants from South Central Asia Disability Age Under 5
COMPARE
Immigrants from South Central Asia
Select to Compare
Disability Age Under 5
Immigrants from South Central Asia Disability Age Under 5
1.0%
DISABILITY | AGE UNDER 5
99.9/ 100
METRIC RATING
30th/ 347
METRIC RANK
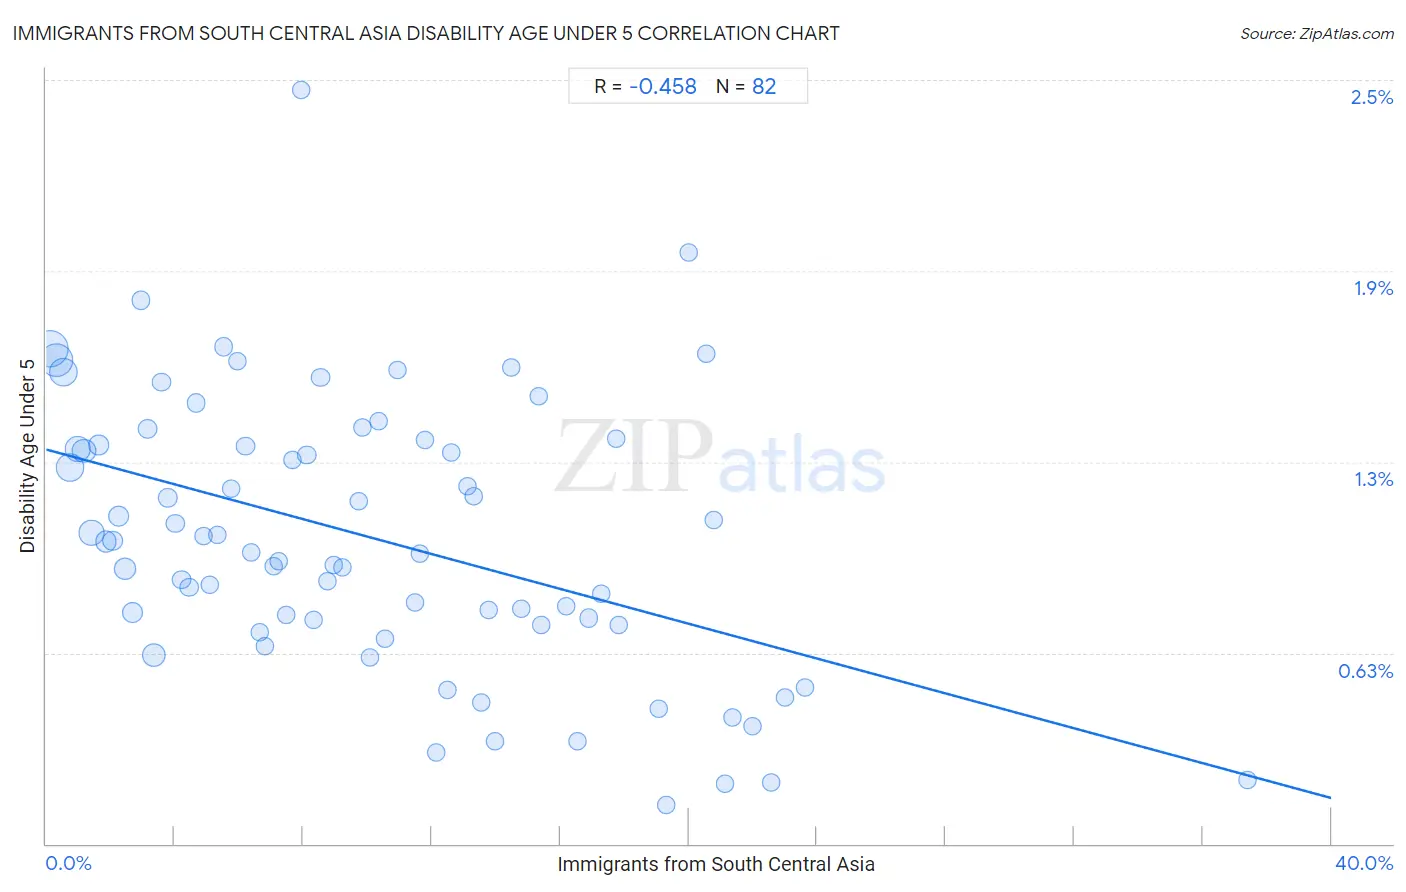
Immigrants from South Central Asia Disability Age Under 5 Correlation Chart
The statistical analysis conducted on geographies consisting of 240,701,404 people shows a moderate negative correlation between the proportion of Immigrants from South Central Asia and percentage of population with a disability under the age of 5 in the United States with a correlation coefficient (R) of -0.458 and weighted average of 1.0%. On average, for every 1% (one percent) increase in Immigrants from South Central Asia within a typical geography, there is a decrease of 0.029% in percentage of population with a disability under the age of 5.
It is essential to understand that the correlation between the percentage of Immigrants from South Central Asia and percentage of population with a disability under the age of 5 does not imply a direct cause-and-effect relationship. It remains uncertain whether the presence of Immigrants from South Central Asia influences an upward or downward trend in the level of percentage of population with a disability under the age of 5 within an area, or if Immigrants from South Central Asia simply ended up residing in those areas with higher or lower levels of percentage of population with a disability under the age of 5 due to other factors.
Demographics Similar to Immigrants from South Central Asia by Disability Age Under 5
In terms of disability age under 5, the demographic groups most similar to Immigrants from South Central Asia are Armenian (1.0%, a difference of 0.28%), Iranian (1.0%, a difference of 0.33%), Bolivian (1.0%, a difference of 0.51%), Immigrants from Belarus (1.0%, a difference of 0.52%), and Immigrants from Ukraine (1.0%, a difference of 0.63%).
| Demographics | Rating | Rank | Disability Age Under 5 |
| Yakama | 100.0 /100 | #23 | Exceptional 1.00% |
| Indians (Asian) | 100.0 /100 | #24 | Exceptional 1.0% |
| Immigrants from Micronesia | 100.0 /100 | #25 | Exceptional 1.0% |
| Immigrants from Taiwan | 100.0 /100 | #26 | Exceptional 1.0% |
| Guyanese | 100.0 /100 | #27 | Exceptional 1.0% |
| Immigrants from Eastern Asia | 100.0 /100 | #28 | Exceptional 1.0% |
| Immigrants from Belarus | 100.0 /100 | #29 | Exceptional 1.0% |
| Immigrants from South Central Asia | 99.9 /100 | #30 | Exceptional 1.0% |
| Armenians | 99.9 /100 | #31 | Exceptional 1.0% |
| Iranians | 99.9 /100 | #32 | Exceptional 1.0% |
| Bolivians | 99.9 /100 | #33 | Exceptional 1.0% |
| Immigrants from Ukraine | 99.9 /100 | #34 | Exceptional 1.0% |
| Barbadians | 99.9 /100 | #35 | Exceptional 1.0% |
| Immigrants from Nepal | 99.9 /100 | #36 | Exceptional 1.0% |
| Immigrants from India | 99.9 /100 | #37 | Exceptional 1.0% |
Immigrants from South Central Asia Disability Age Under 5 Correlation Summary
| Measurement | Immigrants from South Central Asia Data | Disability Age Under 5 Data |
| Minimum | 0.11% | 0.13% |
| Maximum | 37.4% | 2.5% |
| Range | 37.3% | 2.3% |
| Mean | 10.2% | 1.0% |
| Median | 8.8% | 0.97% |
| Interquartile 25% (IQ1) | 4.5% | 0.72% |
| Interquartile 75% (IQ3) | 14.8% | 1.3% |
| Interquartile Range (IQR) | 10.3% | 0.59% |
| Standard Deviation (Sample) | 7.2% | 0.45% |
| Standard Deviation (Population) | 7.1% | 0.44% |
Correlation Details
| Immigrants from South Central Asia Percentile | Sample Size | Disability Age Under 5 |
[ 0.0% - 0.5% ] 0.11% | 42,260,570 | 1.6% |
[ 0.0% - 0.5% ] 0.32% | 33,139,159 | 1.6% |
[ 0.5% - 1.0% ] 0.54% | 24,084,703 | 1.5% |
[ 0.5% - 1.0% ] 0.76% | 22,466,862 | 1.2% |
[ 0.5% - 1.0% ] 0.97% | 15,847,589 | 1.3% |
[ 1.0% - 1.5% ] 1.18% | 13,076,030 | 1.3% |
[ 1.0% - 1.5% ] 1.42% | 15,557,349 | 1.0% |
[ 1.5% - 2.0% ] 1.63% | 5,619,579 | 1.3% |
[ 1.5% - 2.0% ] 1.86% | 7,131,125 | 0.99% |
[ 2.0% - 2.5% ] 2.06% | 4,988,057 | 0.99% |
[ 2.0% - 2.5% ] 2.27% | 5,925,084 | 1.1% |
[ 2.0% - 2.5% ] 2.43% | 8,330,987 | 0.90% |
[ 2.5% - 3.0% ] 2.69% | 5,458,610 | 0.76% |
[ 2.5% - 3.0% ] 2.94% | 1,470,110 | 1.8% |
[ 3.0% - 3.5% ] 3.15% | 2,476,676 | 1.4% |
[ 3.0% - 3.5% ] 3.33% | 10,930,772 | 0.62% |
[ 3.5% - 4.0% ] 3.58% | 1,726,263 | 1.5% |
[ 3.5% - 4.0% ] 3.79% | 1,508,151 | 1.1% |
[ 4.0% - 4.5% ] 4.02% | 1,333,834 | 1.0% |
[ 4.0% - 4.5% ] 4.22% | 1,386,226 | 0.86% |
[ 4.0% - 4.5% ] 4.45% | 1,016,957 | 0.84% |
[ 4.5% - 5.0% ] 4.66% | 592,181 | 1.4% |
[ 4.5% - 5.0% ] 4.90% | 947,723 | 1.0% |
[ 5.0% - 5.5% ] 5.09% | 1,070,199 | 0.85% |
[ 5.0% - 5.5% ] 5.31% | 549,747 | 1.0% |
[ 5.5% - 6.0% ] 5.52% | 568,781 | 1.6% |
[ 5.5% - 6.0% ] 5.75% | 453,476 | 1.2% |
[ 5.5% - 6.0% ] 5.97% | 289,563 | 1.6% |
[ 6.0% - 6.5% ] 6.20% | 587,378 | 1.3% |
[ 6.0% - 6.5% ] 6.36% | 347,861 | 0.95% |
[ 6.5% - 7.0% ] 6.65% | 1,188,819 | 0.69% |
[ 6.5% - 7.0% ] 6.82% | 388,238 | 0.65% |
[ 7.0% - 7.5% ] 7.06% | 291,348 | 0.91% |
[ 7.0% - 7.5% ] 7.22% | 180,925 | 0.92% |
[ 7.0% - 7.5% ] 7.46% | 336,138 | 0.75% |
[ 7.5% - 8.0% ] 7.67% | 280,728 | 1.3% |
[ 7.5% - 8.0% ] 7.95% | 239,534 | 2.5% |
[ 8.0% - 8.5% ] 8.11% | 128,937 | 1.3% |
[ 8.0% - 8.5% ] 8.31% | 569,431 | 0.73% |
[ 8.5% - 9.0% ] 8.54% | 338,515 | 1.5% |
[ 8.5% - 9.0% ] 8.74% | 197,826 | 0.86% |
[ 8.5% - 9.0% ] 8.93% | 88,922 | 0.91% |
[ 9.0% - 9.5% ] 9.23% | 449,423 | 0.90% |
[ 9.5% - 10.0% ] 9.73% | 61,988 | 1.1% |
[ 9.5% - 10.0% ] 9.85% | 239,543 | 1.4% |
[ 10.0% - 10.5% ] 10.08% | 245,099 | 0.61% |
[ 10.0% - 10.5% ] 10.35% | 479,622 | 1.4% |
[ 10.5% - 11.0% ] 10.55% | 73,124 | 0.67% |
[ 10.5% - 11.0% ] 10.93% | 50,094 | 1.5% |
[ 11.0% - 11.5% ] 11.48% | 31,200 | 0.79% |
[ 11.5% - 12.0% ] 11.64% | 435,460 | 0.95% |
[ 11.5% - 12.0% ] 11.78% | 170,113 | 1.3% |
[ 12.0% - 12.5% ] 12.13% | 110,077 | 0.30% |
[ 12.0% - 12.5% ] 12.49% | 287,487 | 0.50% |
[ 12.5% - 13.0% ] 12.61% | 66,586 | 1.3% |
[ 13.0% - 13.5% ] 13.10% | 72,743 | 1.2% |
[ 13.0% - 13.5% ] 13.30% | 99,002 | 1.1% |
[ 13.5% - 14.0% ] 13.53% | 42,140 | 0.46% |
[ 13.5% - 14.0% ] 13.77% | 267,072 | 0.77% |
[ 13.5% - 14.0% ] 13.98% | 37,222 | 0.34% |
[ 14.0% - 14.5% ] 14.46% | 27,794 | 1.6% |
[ 14.5% - 15.0% ] 14.77% | 14,344 | 0.77% |
[ 15.0% - 15.5% ] 15.33% | 50,949 | 1.5% |
[ 15.0% - 15.5% ] 15.43% | 128,058 | 0.72% |
[ 16.0% - 16.5% ] 16.18% | 196,540 | 0.78% |
[ 16.5% - 17.0% ] 16.54% | 91,618 | 0.34% |
[ 16.5% - 17.0% ] 16.90% | 140,320 | 0.74% |
[ 17.0% - 17.5% ] 17.26% | 188,904 | 0.82% |
[ 17.5% - 18.0% ] 17.74% | 197,696 | 1.3% |
[ 17.5% - 18.0% ] 17.82% | 103,837 | 0.72% |
[ 19.0% - 19.5% ] 19.06% | 89,742 | 0.44% |
[ 19.0% - 19.5% ] 19.29% | 71,445 | 0.13% |
[ 20.0% - 20.5% ] 20.00% | 43,520 | 1.9% |
[ 20.5% - 21.0% ] 20.53% | 49,217 | 1.6% |
[ 20.5% - 21.0% ] 20.77% | 32,559 | 1.1% |
[ 21.0% - 21.5% ] 21.12% | 43,213 | 0.20% |
[ 21.0% - 21.5% ] 21.35% | 155,241 | 0.42% |
[ 21.5% - 22.0% ] 21.99% | 61,414 | 0.38% |
[ 22.5% - 23.0% ] 22.57% | 228,795 | 0.20% |
[ 22.5% - 23.0% ] 23.00% | 64,268 | 0.48% |
[ 23.5% - 24.0% ] 23.60% | 88,402 | 0.51% |
[ 37.0% - 37.5% ] 37.40% | 44,570 | 0.21% |