Immigrants from Iran Self-Care Disability
COMPARE
Immigrants from Iran
Select to Compare
Self-Care Disability
Immigrants from Iran Self-Care Disability
2.7%
SELF-CARE DISABILITY
0.2/ 100
METRIC RATING
264th/ 347
METRIC RANK
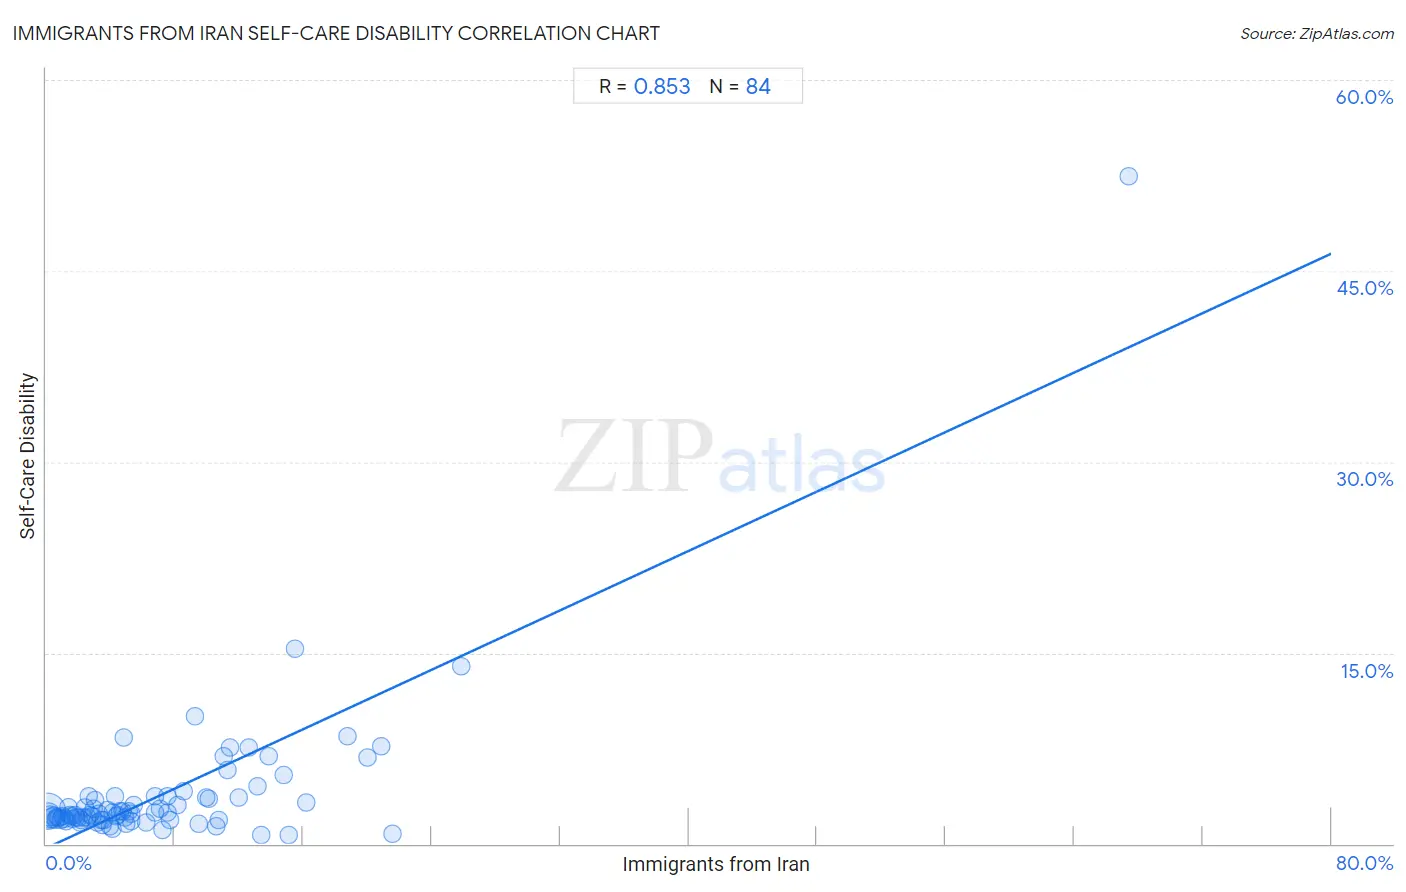
Immigrants from Iran Self-Care Disability Correlation Chart
The statistical analysis conducted on geographies consisting of 279,736,483 people shows a very strong positive correlation between the proportion of Immigrants from Iran and percentage of population with self-care disability in the United States with a correlation coefficient (R) of 0.853 and weighted average of 2.7%. On average, for every 1% (one percent) increase in Immigrants from Iran within a typical geography, there is an increase of 0.58% in percentage of population with self-care disability.
It is essential to understand that the correlation between the percentage of Immigrants from Iran and percentage of population with self-care disability does not imply a direct cause-and-effect relationship. It remains uncertain whether the presence of Immigrants from Iran influences an upward or downward trend in the level of percentage of population with self-care disability within an area, or if Immigrants from Iran simply ended up residing in those areas with higher or lower levels of percentage of population with self-care disability due to other factors.
Demographics Similar to Immigrants from Iran by Self-Care Disability
In terms of self-care disability, the demographic groups most similar to Immigrants from Iran are Immigrants from Latin America (2.7%, a difference of 0.060%), Shoshone (2.7%, a difference of 0.13%), Immigrants from Nicaragua (2.7%, a difference of 0.16%), Immigrants from Cambodia (2.7%, a difference of 0.21%), and Arapaho (2.6%, a difference of 0.27%).
| Demographics | Rating | Rank | Self-Care Disability |
| Potawatomi | 0.3 /100 | #257 | Tragic 2.6% |
| Nonimmigrants | 0.3 /100 | #258 | Tragic 2.6% |
| Immigrants from Belarus | 0.2 /100 | #259 | Tragic 2.6% |
| Chippewa | 0.2 /100 | #260 | Tragic 2.6% |
| Arapaho | 0.2 /100 | #261 | Tragic 2.6% |
| Shoshone | 0.2 /100 | #262 | Tragic 2.7% |
| Immigrants from Latin America | 0.2 /100 | #263 | Tragic 2.7% |
| Immigrants from Iran | 0.2 /100 | #264 | Tragic 2.7% |
| Immigrants from Nicaragua | 0.2 /100 | #265 | Tragic 2.7% |
| Immigrants from Cambodia | 0.1 /100 | #266 | Tragic 2.7% |
| Yaqui | 0.1 /100 | #267 | Tragic 2.7% |
| Immigrants from Mexico | 0.1 /100 | #268 | Tragic 2.7% |
| U.S. Virgin Islanders | 0.1 /100 | #269 | Tragic 2.7% |
| Immigrants from Micronesia | 0.1 /100 | #270 | Tragic 2.7% |
| Trinidadians and Tobagonians | 0.1 /100 | #271 | Tragic 2.7% |
Immigrants from Iran Self-Care Disability Correlation Summary
| Measurement | Immigrants from Iran Data | Self-Care Disability Data |
| Minimum | 0.052% | 0.72% |
| Maximum | 67.4% | 52.5% |
| Range | 67.3% | 51.8% |
| Mean | 7.2% | 3.9% |
| Median | 4.7% | 2.3% |
| Interquartile 25% (IQ1) | 2.3% | 1.9% |
| Interquartile 75% (IQ3) | 10.0% | 3.6% |
| Interquartile Range (IQR) | 7.8% | 1.7% |
| Standard Deviation (Sample) | 8.7% | 6.0% |
| Standard Deviation (Population) | 8.7% | 5.9% |
Correlation Details
| Immigrants from Iran Percentile | Sample Size | Self-Care Disability |
[ 0.0% - 0.5% ] 0.052% | 151,538,644 | 2.5% |
[ 0.0% - 0.5% ] 0.15% | 53,205,223 | 2.2% |
[ 0.0% - 0.5% ] 0.26% | 24,758,388 | 2.2% |
[ 0.0% - 0.5% ] 0.37% | 13,222,134 | 2.0% |
[ 0.0% - 0.5% ] 0.49% | 9,942,938 | 2.1% |
[ 0.5% - 1.0% ] 0.58% | 4,741,872 | 1.9% |
[ 0.5% - 1.0% ] 0.70% | 3,091,524 | 2.1% |
[ 0.5% - 1.0% ] 0.81% | 1,998,186 | 2.1% |
[ 0.5% - 1.0% ] 0.91% | 2,344,759 | 1.9% |
[ 1.0% - 1.5% ] 1.01% | 2,207,860 | 2.2% |
[ 1.0% - 1.5% ] 1.12% | 661,232 | 2.0% |
[ 1.0% - 1.5% ] 1.24% | 1,339,273 | 1.8% |
[ 1.0% - 1.5% ] 1.37% | 4,533,089 | 2.9% |
[ 1.0% - 1.5% ] 1.46% | 538,895 | 2.2% |
[ 1.5% - 2.0% ] 1.56% | 813,324 | 2.1% |
[ 1.5% - 2.0% ] 1.66% | 386,820 | 2.0% |
[ 1.5% - 2.0% ] 1.77% | 322,444 | 2.2% |
[ 1.5% - 2.0% ] 1.89% | 263,874 | 2.1% |
[ 1.5% - 2.0% ] 1.99% | 138,865 | 2.1% |
[ 2.0% - 2.5% ] 2.10% | 174,310 | 1.7% |
[ 2.0% - 2.5% ] 2.19% | 196,829 | 1.9% |
[ 2.0% - 2.5% ] 2.31% | 193,289 | 2.0% |
[ 2.0% - 2.5% ] 2.44% | 80,534 | 2.8% |
[ 2.5% - 3.0% ] 2.53% | 166,828 | 2.0% |
[ 2.5% - 3.0% ] 2.65% | 62,121 | 3.7% |
[ 2.5% - 3.0% ] 2.74% | 237,161 | 2.3% |
[ 2.5% - 3.0% ] 2.90% | 37,654 | 2.2% |
[ 2.5% - 3.0% ] 2.97% | 168,262 | 2.8% |
[ 3.0% - 3.5% ] 3.06% | 95,207 | 3.4% |
[ 3.0% - 3.5% ] 3.17% | 366,071 | 1.7% |
[ 3.0% - 3.5% ] 3.28% | 205,431 | 2.3% |
[ 3.0% - 3.5% ] 3.42% | 106,622 | 1.9% |
[ 3.5% - 4.0% ] 3.54% | 104,589 | 1.4% |
[ 3.5% - 4.0% ] 3.59% | 31,657 | 1.9% |
[ 3.5% - 4.0% ] 3.82% | 33,685 | 2.7% |
[ 3.5% - 4.0% ] 3.96% | 23,223 | 1.3% |
[ 4.0% - 4.5% ] 4.09% | 6,915 | 1.2% |
[ 4.0% - 4.5% ] 4.10% | 29,744 | 2.5% |
[ 4.0% - 4.5% ] 4.28% | 20,411 | 3.7% |
[ 4.0% - 4.5% ] 4.33% | 4,410 | 2.2% |
[ 4.0% - 4.5% ] 4.46% | 133,954 | 2.2% |
[ 4.5% - 5.0% ] 4.62% | 21,080 | 2.5% |
[ 4.5% - 5.0% ] 4.72% | 36,842 | 2.6% |
[ 4.5% - 5.0% ] 4.79% | 2,318 | 8.3% |
[ 4.5% - 5.0% ] 4.88% | 38,003 | 2.1% |
[ 4.5% - 5.0% ] 4.96% | 29,544 | 1.5% |
[ 5.0% - 5.5% ] 5.12% | 31,381 | 2.5% |
[ 5.0% - 5.5% ] 5.26% | 35,819 | 1.8% |
[ 5.0% - 5.5% ] 5.30% | 73,595 | 2.4% |
[ 5.0% - 5.5% ] 5.43% | 54,074 | 3.0% |
[ 6.0% - 6.5% ] 6.19% | 28,792 | 1.7% |
[ 6.5% - 7.0% ] 6.74% | 30,549 | 2.5% |
[ 6.5% - 7.0% ] 6.80% | 30,599 | 3.7% |
[ 7.0% - 7.5% ] 7.05% | 2,936 | 2.7% |
[ 7.0% - 7.5% ] 7.22% | 44,429 | 1.1% |
[ 7.5% - 8.0% ] 7.51% | 7,509 | 3.7% |
[ 7.5% - 8.0% ] 7.58% | 28,765 | 2.4% |
[ 7.5% - 8.0% ] 7.72% | 50,392 | 1.9% |
[ 8.0% - 8.5% ] 8.15% | 44,862 | 3.1% |
[ 8.5% - 9.0% ] 8.58% | 16,246 | 4.1% |
[ 9.0% - 9.5% ] 9.23% | 38,408 | 10.1% |
[ 9.5% - 10.0% ] 9.51% | 17,076 | 1.5% |
[ 9.5% - 10.0% ] 9.95% | 16,190 | 3.6% |
[ 10.0% - 10.5% ] 10.11% | 49,408 | 3.5% |
[ 10.5% - 11.0% ] 10.60% | 11,060 | 1.4% |
[ 10.5% - 11.0% ] 10.73% | 1,445 | 1.9% |
[ 11.0% - 11.5% ] 11.04% | 462 | 6.9% |
[ 11.0% - 11.5% ] 11.26% | 23,193 | 5.8% |
[ 11.0% - 11.5% ] 11.42% | 18,445 | 7.5% |
[ 12.0% - 12.5% ] 12.01% | 9,699 | 3.6% |
[ 12.5% - 13.0% ] 12.57% | 18,951 | 7.6% |
[ 13.0% - 13.5% ] 13.18% | 59,525 | 4.5% |
[ 13.0% - 13.5% ] 13.42% | 9,105 | 0.73% |
[ 13.5% - 14.0% ] 13.81% | 195,069 | 6.8% |
[ 14.5% - 15.0% ] 14.76% | 51,474 | 5.4% |
[ 15.0% - 15.5% ] 15.07% | 5,593 | 0.72% |
[ 15.0% - 15.5% ] 15.45% | 1,139 | 15.3% |
[ 16.0% - 16.5% ] 16.21% | 16,679 | 3.2% |
[ 18.5% - 19.0% ] 18.76% | 22,831 | 8.5% |
[ 20.0% - 20.5% ] 20.01% | 22,163 | 6.8% |
[ 20.5% - 21.0% ] 20.87% | 11,091 | 7.7% |
[ 21.5% - 22.0% ] 21.54% | 1,207 | 0.77% |
[ 25.5% - 26.0% ] 25.87% | 143 | 14.0% |
[ 67.0% - 67.5% ] 67.38% | 141 | 52.5% |