Immigrants from Iran Disability Age Under 5
COMPARE
Immigrants from Iran
Select to Compare
Disability Age Under 5
Immigrants from Iran Disability Age Under 5
1.00%
DISABILITY | AGE UNDER 5
100.0/ 100
METRIC RATING
22nd/ 347
METRIC RANK
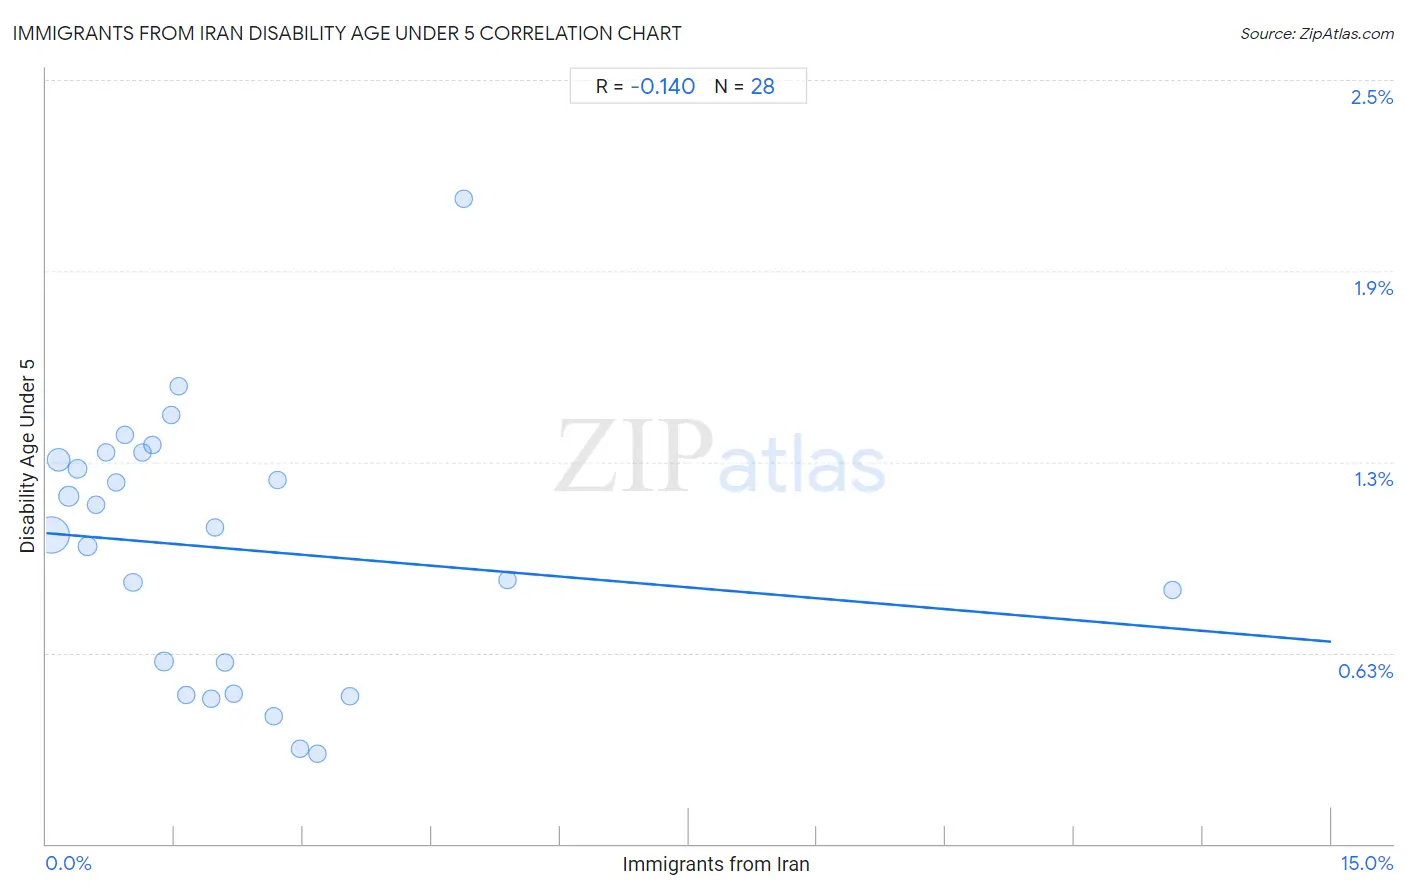
Immigrants from Iran Disability Age Under 5 Correlation Chart
The statistical analysis conducted on geographies consisting of 168,672,244 people shows a poor negative correlation between the proportion of Immigrants from Iran and percentage of population with a disability under the age of 5 in the United States with a correlation coefficient (R) of -0.140 and weighted average of 1.00%. On average, for every 1% (one percent) increase in Immigrants from Iran within a typical geography, there is a decrease of 0.024% in percentage of population with a disability under the age of 5.
It is essential to understand that the correlation between the percentage of Immigrants from Iran and percentage of population with a disability under the age of 5 does not imply a direct cause-and-effect relationship. It remains uncertain whether the presence of Immigrants from Iran influences an upward or downward trend in the level of percentage of population with a disability under the age of 5 within an area, or if Immigrants from Iran simply ended up residing in those areas with higher or lower levels of percentage of population with a disability under the age of 5 due to other factors.
Demographics Similar to Immigrants from Iran by Disability Age Under 5
In terms of disability age under 5, the demographic groups most similar to Immigrants from Iran are Yakama (1.00%, a difference of 0.080%), Indian (Asian) (1.0%, a difference of 0.36%), Immigrants from Micronesia (1.0%, a difference of 0.67%), British West Indian (0.99%, a difference of 0.79%), and Immigrants from Taiwan (1.0%, a difference of 0.79%).
| Demographics | Rating | Rank | Disability Age Under 5 |
| Immigrants from Hong Kong | 100.0 /100 | #15 | Exceptional 0.95% |
| Immigrants from Israel | 100.0 /100 | #16 | Exceptional 0.96% |
| Immigrants from China | 100.0 /100 | #17 | Exceptional 0.96% |
| Immigrants from Barbados | 100.0 /100 | #18 | Exceptional 0.97% |
| Puget Sound Salish | 100.0 /100 | #19 | Exceptional 0.97% |
| Nepalese | 100.0 /100 | #20 | Exceptional 0.97% |
| British West Indians | 100.0 /100 | #21 | Exceptional 0.99% |
| Immigrants from Iran | 100.0 /100 | #22 | Exceptional 1.00% |
| Yakama | 100.0 /100 | #23 | Exceptional 1.00% |
| Indians (Asian) | 100.0 /100 | #24 | Exceptional 1.0% |
| Immigrants from Micronesia | 100.0 /100 | #25 | Exceptional 1.0% |
| Immigrants from Taiwan | 100.0 /100 | #26 | Exceptional 1.0% |
| Guyanese | 100.0 /100 | #27 | Exceptional 1.0% |
| Immigrants from Eastern Asia | 100.0 /100 | #28 | Exceptional 1.0% |
| Immigrants from Belarus | 100.0 /100 | #29 | Exceptional 1.0% |
Immigrants from Iran Disability Age Under 5 Correlation Summary
| Measurement | Immigrants from Iran Data | Disability Age Under 5 Data |
| Minimum | 0.053% | 0.30% |
| Maximum | 13.1% | 2.1% |
| Range | 13.1% | 1.8% |
| Mean | 2.2% | 0.97% |
| Median | 1.5% | 1.0% |
| Interquartile 25% (IQ1) | 0.76% | 0.54% |
| Interquartile 75% (IQ3) | 2.7% | 1.3% |
| Interquartile Range (IQR) | 1.9% | 0.73% |
| Standard Deviation (Sample) | 2.5% | 0.43% |
| Standard Deviation (Population) | 2.5% | 0.42% |
Correlation Details
| Immigrants from Iran Percentile | Sample Size | Disability Age Under 5 |
[ 0.0% - 0.5% ] 0.053% | 101,155,333 | 1.0% |
[ 0.0% - 0.5% ] 0.15% | 28,526,162 | 1.3% |
[ 0.0% - 0.5% ] 0.26% | 13,240,384 | 1.1% |
[ 0.0% - 0.5% ] 0.36% | 6,277,401 | 1.2% |
[ 0.0% - 0.5% ] 0.49% | 6,010,687 | 0.97% |
[ 0.5% - 1.0% ] 0.58% | 2,416,666 | 1.1% |
[ 0.5% - 1.0% ] 0.70% | 1,321,096 | 1.3% |
[ 0.5% - 1.0% ] 0.81% | 863,534 | 1.2% |
[ 0.5% - 1.0% ] 0.92% | 1,048,317 | 1.3% |
[ 1.0% - 1.5% ] 1.01% | 1,368,024 | 0.86% |
[ 1.0% - 1.5% ] 1.13% | 240,761 | 1.3% |
[ 1.0% - 1.5% ] 1.24% | 565,313 | 1.3% |
[ 1.0% - 1.5% ] 1.37% | 4,015,826 | 0.60% |
[ 1.0% - 1.5% ] 1.46% | 210,235 | 1.4% |
[ 1.5% - 2.0% ] 1.55% | 344,950 | 1.5% |
[ 1.5% - 2.0% ] 1.63% | 90,802 | 0.49% |
[ 1.5% - 2.0% ] 1.92% | 61,568 | 0.47% |
[ 1.5% - 2.0% ] 1.96% | 23,795 | 1.0% |
[ 2.0% - 2.5% ] 2.09% | 57,363 | 0.59% |
[ 2.0% - 2.5% ] 2.19% | 70,687 | 0.49% |
[ 2.5% - 3.0% ] 2.65% | 48,073 | 0.42% |
[ 2.5% - 3.0% ] 2.71% | 106,238 | 1.2% |
[ 2.5% - 3.0% ] 2.96% | 142,553 | 0.31% |
[ 3.0% - 3.5% ] 3.17% | 304,527 | 0.30% |
[ 3.5% - 4.0% ] 3.54% | 70,232 | 0.48% |
[ 4.5% - 5.0% ] 4.88% | 38,003 | 2.1% |
[ 5.0% - 5.5% ] 5.39% | 26,595 | 0.86% |
[ 13.0% - 13.5% ] 13.15% | 27,119 | 0.83% |