Immigrants from Iran Wage/Income Gap
COMPARE
Immigrants from Iran
Select to Compare
Wage/Income Gap
Immigrants from Iran Wage/Income Gap
29.1%
WAGE/INCOME GAP
0.0/ 100
METRIC RATING
327th/ 347
METRIC RANK
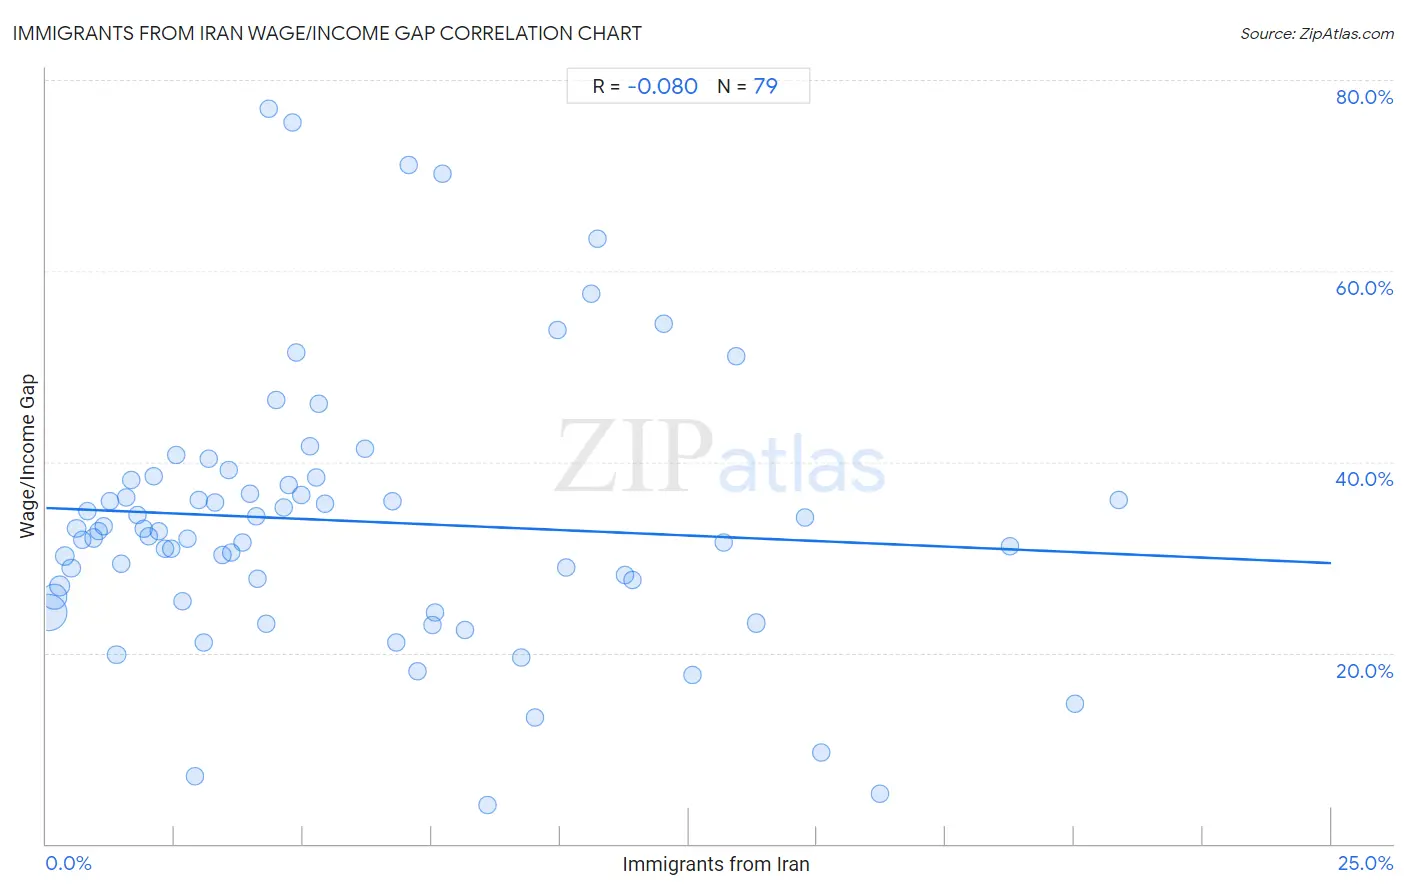
Immigrants from Iran Wage/Income Gap Correlation Chart
The statistical analysis conducted on geographies consisting of 279,798,376 people shows a slight negative correlation between the proportion of Immigrants from Iran and wage/income gap percentage in the United States with a correlation coefficient (R) of -0.080 and weighted average of 29.1%. On average, for every 1% (one percent) increase in Immigrants from Iran within a typical geography, there is a decrease of 0.23% in wage/income gap percentage.
It is essential to understand that the correlation between the percentage of Immigrants from Iran and wage/income gap percentage does not imply a direct cause-and-effect relationship. It remains uncertain whether the presence of Immigrants from Iran influences an upward or downward trend in the level of wage/income gap percentage within an area, or if Immigrants from Iran simply ended up residing in those areas with higher or lower levels of wage/income gap percentage due to other factors.
Demographics Similar to Immigrants from Iran by Wage/Income Gap
In terms of wage/income gap, the demographic groups most similar to Immigrants from Iran are Scandinavian (29.1%, a difference of 0.060%), Immigrants from Belgium (29.0%, a difference of 0.11%), Hungarian (29.0%, a difference of 0.18%), Scottish (29.1%, a difference of 0.20%), and German (29.2%, a difference of 0.30%).
| Demographics | Rating | Rank | Wage/Income Gap |
| British | 0.1 /100 | #320 | Tragic 28.9% |
| Welsh | 0.1 /100 | #321 | Tragic 28.9% |
| Immigrants from Singapore | 0.1 /100 | #322 | Tragic 28.9% |
| Norwegians | 0.1 /100 | #323 | Tragic 29.0% |
| Croatians | 0.0 /100 | #324 | Tragic 29.0% |
| Hungarians | 0.0 /100 | #325 | Tragic 29.0% |
| Immigrants from Belgium | 0.0 /100 | #326 | Tragic 29.0% |
| Immigrants from Iran | 0.0 /100 | #327 | Tragic 29.1% |
| Scandinavians | 0.0 /100 | #328 | Tragic 29.1% |
| Scottish | 0.0 /100 | #329 | Tragic 29.1% |
| Germans | 0.0 /100 | #330 | Tragic 29.2% |
| Czechs | 0.0 /100 | #331 | Tragic 29.2% |
| Immigrants from South Central Asia | 0.0 /100 | #332 | Tragic 29.3% |
| Europeans | 0.0 /100 | #333 | Tragic 29.4% |
| Swedes | 0.0 /100 | #334 | Tragic 29.4% |
Immigrants from Iran Wage/Income Gap Correlation Summary
| Measurement | Immigrants from Iran Data | Wage/Income Gap Data |
| Minimum | 0.052% | 4.0% |
| Maximum | 20.9% | 77.0% |
| Range | 20.8% | 73.0% |
| Mean | 5.9% | 33.8% |
| Median | 4.3% | 32.7% |
| Interquartile 25% (IQ1) | 2.1% | 25.9% |
| Interquartile 75% (IQ3) | 8.6% | 38.2% |
| Interquartile Range (IQR) | 6.5% | 12.3% |
| Standard Deviation (Sample) | 5.0% | 14.3% |
| Standard Deviation (Population) | 4.9% | 14.2% |
Correlation Details
| Immigrants from Iran Percentile | Sample Size | Wage/Income Gap |
[ 0.0% - 0.5% ] 0.052% | 151,556,960 | 24.2% |
[ 0.0% - 0.5% ] 0.15% | 53,239,755 | 25.9% |
[ 0.0% - 0.5% ] 0.26% | 24,771,092 | 27.0% |
[ 0.0% - 0.5% ] 0.37% | 13,233,304 | 30.2% |
[ 0.0% - 0.5% ] 0.49% | 9,933,791 | 28.9% |
[ 0.5% - 1.0% ] 0.58% | 4,742,572 | 33.0% |
[ 0.5% - 1.0% ] 0.70% | 3,095,240 | 31.8% |
[ 0.5% - 1.0% ] 0.81% | 2,003,220 | 34.8% |
[ 0.5% - 1.0% ] 0.91% | 2,343,942 | 32.0% |
[ 1.0% - 1.5% ] 1.01% | 2,211,397 | 32.8% |
[ 1.0% - 1.5% ] 1.12% | 665,605 | 33.3% |
[ 1.0% - 1.5% ] 1.24% | 1,333,947 | 35.9% |
[ 1.0% - 1.5% ] 1.37% | 4,528,337 | 19.8% |
[ 1.0% - 1.5% ] 1.46% | 537,595 | 29.3% |
[ 1.5% - 2.0% ] 1.56% | 812,763 | 36.2% |
[ 1.5% - 2.0% ] 1.66% | 385,896 | 38.2% |
[ 1.5% - 2.0% ] 1.77% | 323,049 | 34.4% |
[ 1.5% - 2.0% ] 1.89% | 263,874 | 33.0% |
[ 1.5% - 2.0% ] 1.99% | 135,494 | 32.3% |
[ 2.0% - 2.5% ] 2.10% | 174,310 | 38.5% |
[ 2.0% - 2.5% ] 2.19% | 195,929 | 32.7% |
[ 2.0% - 2.5% ] 2.31% | 193,289 | 30.9% |
[ 2.0% - 2.5% ] 2.44% | 86,240 | 30.8% |
[ 2.5% - 3.0% ] 2.53% | 166,828 | 40.7% |
[ 2.5% - 3.0% ] 2.65% | 62,121 | 25.4% |
[ 2.5% - 3.0% ] 2.75% | 235,469 | 32.0% |
[ 2.5% - 3.0% ] 2.90% | 37,204 | 7.1% |
[ 2.5% - 3.0% ] 2.97% | 166,645 | 36.0% |
[ 3.0% - 3.5% ] 3.06% | 92,199 | 21.1% |
[ 3.0% - 3.5% ] 3.17% | 366,071 | 40.3% |
[ 3.0% - 3.5% ] 3.28% | 205,431 | 35.7% |
[ 3.0% - 3.5% ] 3.42% | 106,622 | 30.3% |
[ 3.5% - 4.0% ] 3.54% | 103,911 | 39.2% |
[ 3.5% - 4.0% ] 3.59% | 31,657 | 30.5% |
[ 3.5% - 4.0% ] 3.82% | 33,292 | 31.6% |
[ 3.5% - 4.0% ] 3.95% | 24,177 | 36.7% |
[ 4.0% - 4.5% ] 4.09% | 6,915 | 34.3% |
[ 4.0% - 4.5% ] 4.10% | 29,744 | 27.7% |
[ 4.0% - 4.5% ] 4.28% | 20,411 | 23.1% |
[ 4.0% - 4.5% ] 4.33% | 4,410 | 77.0% |
[ 4.0% - 4.5% ] 4.46% | 133,954 | 46.5% |
[ 4.5% - 5.0% ] 4.62% | 21,080 | 35.2% |
[ 4.5% - 5.0% ] 4.72% | 36,842 | 37.6% |
[ 4.5% - 5.0% ] 4.79% | 2,318 | 75.5% |
[ 4.5% - 5.0% ] 4.88% | 38,003 | 51.4% |
[ 4.5% - 5.0% ] 4.96% | 29,544 | 36.6% |
[ 5.0% - 5.5% ] 5.12% | 31,381 | 41.6% |
[ 5.0% - 5.5% ] 5.26% | 35,819 | 38.4% |
[ 5.0% - 5.5% ] 5.30% | 73,595 | 46.1% |
[ 5.0% - 5.5% ] 5.43% | 54,074 | 35.6% |
[ 6.0% - 6.5% ] 6.19% | 28,792 | 41.4% |
[ 6.5% - 7.0% ] 6.74% | 30,549 | 35.9% |
[ 6.5% - 7.0% ] 6.80% | 30,599 | 21.1% |
[ 7.0% - 7.5% ] 7.05% | 2,936 | 71.2% |
[ 7.0% - 7.5% ] 7.22% | 44,429 | 18.1% |
[ 7.5% - 8.0% ] 7.51% | 7,509 | 22.9% |
[ 7.5% - 8.0% ] 7.58% | 28,765 | 24.3% |
[ 7.5% - 8.0% ] 7.72% | 50,392 | 70.1% |
[ 8.0% - 8.5% ] 8.15% | 44,862 | 22.4% |
[ 8.5% - 9.0% ] 8.58% | 15,377 | 4.0% |
[ 9.0% - 9.5% ] 9.23% | 38,408 | 19.5% |
[ 9.5% - 10.0% ] 9.51% | 17,076 | 13.2% |
[ 9.5% - 10.0% ] 9.95% | 16,190 | 53.8% |
[ 10.0% - 10.5% ] 10.11% | 49,408 | 29.0% |
[ 10.5% - 11.0% ] 10.60% | 11,060 | 57.6% |
[ 10.5% - 11.0% ] 10.73% | 1,445 | 63.4% |
[ 11.0% - 11.5% ] 11.26% | 23,193 | 28.1% |
[ 11.0% - 11.5% ] 11.42% | 18,445 | 27.6% |
[ 12.0% - 12.5% ] 12.01% | 9,699 | 54.5% |
[ 12.5% - 13.0% ] 12.57% | 18,951 | 17.6% |
[ 13.0% - 13.5% ] 13.18% | 59,525 | 31.5% |
[ 13.0% - 13.5% ] 13.42% | 9,105 | 51.1% |
[ 13.5% - 14.0% ] 13.81% | 194,512 | 23.1% |
[ 14.5% - 15.0% ] 14.76% | 51,474 | 34.2% |
[ 15.0% - 15.5% ] 15.07% | 5,593 | 9.6% |
[ 16.0% - 16.5% ] 16.21% | 16,679 | 5.2% |
[ 18.5% - 19.0% ] 18.76% | 22,831 | 31.2% |
[ 20.0% - 20.5% ] 20.01% | 22,163 | 14.6% |
[ 20.5% - 21.0% ] 20.87% | 11,091 | 36.0% |