Immigrants from Iran Married-couple Households
COMPARE
Immigrants from Iran
Select to Compare
Married-couple Households
Immigrants from Iran Married-couple Households
48.8%
MARRIED-COUPLE HOUSEHOLDS
99.6/ 100
METRIC RATING
43rd/ 347
METRIC RANK
Immigrants from Iran Married-couple Households Correlation Chart
The statistical analysis conducted on geographies consisting of 279,826,479 people shows a poor positive correlation between the proportion of Immigrants from Iran and percentage of married-couple family households in the United States with a correlation coefficient (R) of 0.137 and weighted average of 48.8%. On average, for every 1% (one percent) increase in Immigrants from Iran within a typical geography, there is an increase of 0.20% in percentage of married-couple family households.
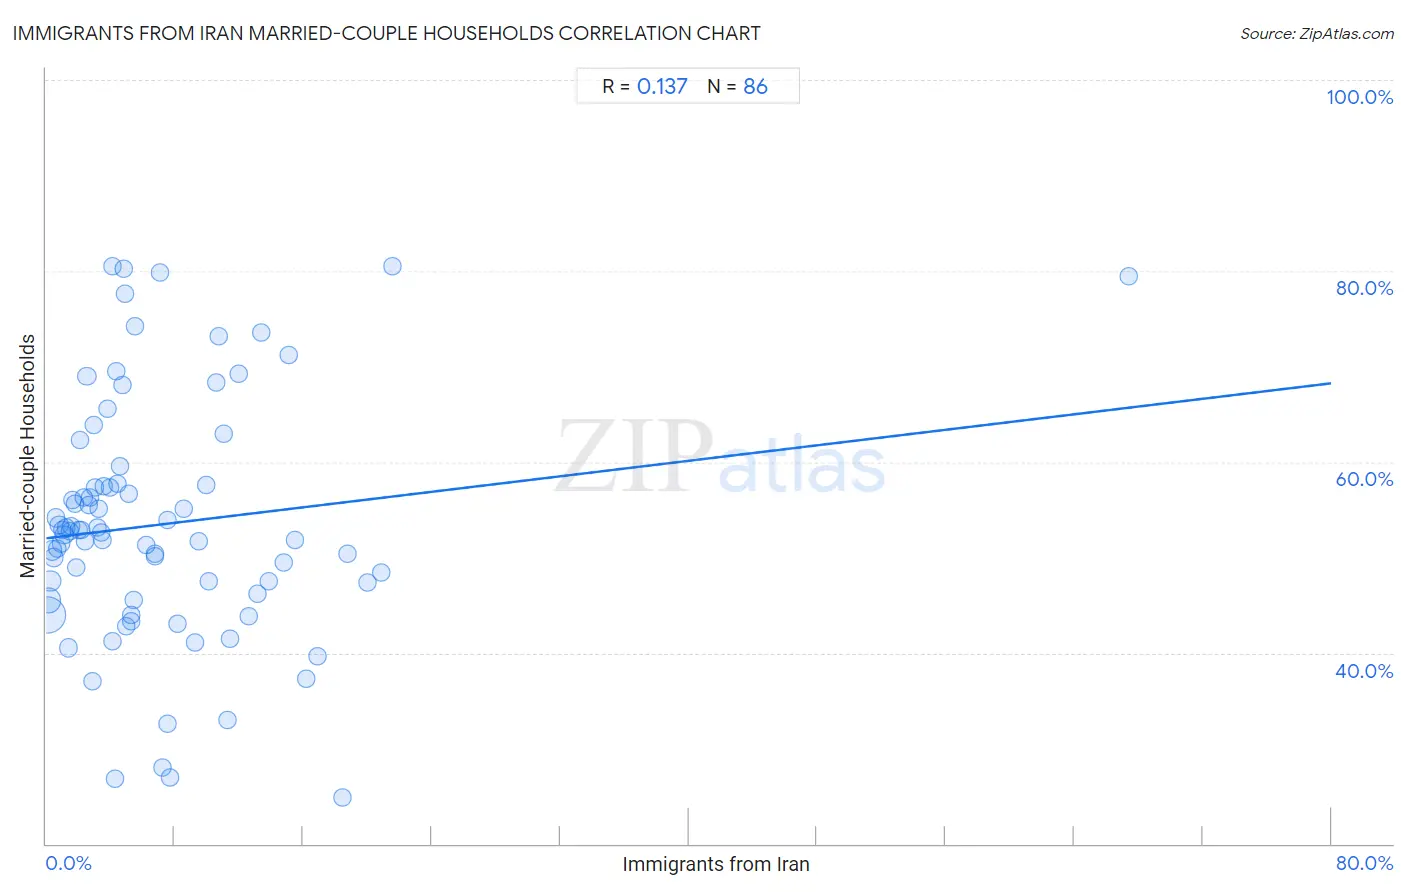
It is essential to understand that the correlation between the percentage of Immigrants from Iran and percentage of married-couple family households does not imply a direct cause-and-effect relationship. It remains uncertain whether the presence of Immigrants from Iran influences an upward or downward trend in the level of percentage of married-couple family households within an area, or if Immigrants from Iran simply ended up residing in those areas with higher or lower levels of percentage of married-couple family households due to other factors.
Demographics Similar to Immigrants from Iran by Married-couple Households
In terms of married-couple households, the demographic groups most similar to Immigrants from Iran are Welsh (48.8%, a difference of 0.050%), Immigrants from Vietnam (48.8%, a difference of 0.060%), Immigrants from Eastern Asia (48.8%, a difference of 0.080%), Immigrants from Lebanon (48.9%, a difference of 0.10%), and Tsimshian (48.7%, a difference of 0.13%).
| Demographics | Rating | Rank | Married-couple Households |
| Iranians | 99.7 /100 | #36 | Exceptional 49.0% |
| Sri Lankans | 99.7 /100 | #37 | Exceptional 49.0% |
| Greeks | 99.7 /100 | #38 | Exceptional 48.9% |
| Lithuanians | 99.6 /100 | #39 | Exceptional 48.9% |
| Immigrants from Bolivia | 99.6 /100 | #40 | Exceptional 48.9% |
| Immigrants from Lebanon | 99.6 /100 | #41 | Exceptional 48.9% |
| Immigrants from Vietnam | 99.6 /100 | #42 | Exceptional 48.8% |
| Immigrants from Iran | 99.6 /100 | #43 | Exceptional 48.8% |
| Welsh | 99.5 /100 | #44 | Exceptional 48.8% |
| Immigrants from Eastern Asia | 99.5 /100 | #45 | Exceptional 48.8% |
| Tsimshian | 99.5 /100 | #46 | Exceptional 48.7% |
| British | 99.5 /100 | #47 | Exceptional 48.7% |
| Indians (Asian) | 99.4 /100 | #48 | Exceptional 48.7% |
| Immigrants from Sri Lanka | 99.4 /100 | #49 | Exceptional 48.7% |
| Samoans | 99.4 /100 | #50 | Exceptional 48.7% |
Immigrants from Iran Married-couple Households Correlation Summary
| Measurement | Immigrants from Iran Data | Married-couple Households Data |
| Minimum | 0.052% | 24.8% |
| Maximum | 67.4% | 80.5% |
| Range | 67.3% | 55.7% |
| Mean | 7.2% | 53.5% |
| Median | 4.8% | 52.7% |
| Interquartile 25% (IQ1) | 2.3% | 46.2% |
| Interquartile 75% (IQ3) | 10.1% | 57.6% |
| Interquartile Range (IQR) | 7.8% | 11.3% |
| Standard Deviation (Sample) | 8.5% | 12.6% |
| Standard Deviation (Population) | 8.5% | 12.6% |
Correlation Details
| Immigrants from Iran Percentile | Sample Size | Married-couple Households |
[ 0.0% - 0.5% ] 0.052% | 151,540,129 | 43.9% |
[ 0.0% - 0.5% ] 0.15% | 53,236,339 | 45.5% |
[ 0.0% - 0.5% ] 0.26% | 24,753,077 | 47.5% |
[ 0.0% - 0.5% ] 0.37% | 13,231,513 | 50.7% |
[ 0.0% - 0.5% ] 0.49% | 9,942,938 | 50.0% |
[ 0.5% - 1.0% ] 0.58% | 4,745,068 | 54.1% |
[ 0.5% - 1.0% ] 0.70% | 3,096,782 | 50.9% |
[ 0.5% - 1.0% ] 0.81% | 2,014,469 | 53.4% |
[ 0.5% - 1.0% ] 0.91% | 2,347,521 | 51.5% |
[ 1.0% - 1.5% ] 1.01% | 2,211,397 | 52.9% |
[ 1.0% - 1.5% ] 1.12% | 665,605 | 52.4% |
[ 1.0% - 1.5% ] 1.24% | 1,340,432 | 53.1% |
[ 1.0% - 1.5% ] 1.37% | 4,533,089 | 40.5% |
[ 1.0% - 1.5% ] 1.46% | 539,854 | 52.8% |
[ 1.5% - 2.0% ] 1.56% | 813,324 | 53.2% |
[ 1.5% - 2.0% ] 1.66% | 386,820 | 56.0% |
[ 1.5% - 2.0% ] 1.78% | 324,326 | 55.6% |
[ 1.5% - 2.0% ] 1.89% | 263,874 | 49.0% |
[ 1.5% - 2.0% ] 1.99% | 139,534 | 52.9% |
[ 2.0% - 2.5% ] 2.10% | 174,310 | 62.3% |
[ 2.0% - 2.5% ] 2.19% | 196,829 | 52.8% |
[ 2.0% - 2.5% ] 2.31% | 193,289 | 56.2% |
[ 2.0% - 2.5% ] 2.44% | 87,748 | 51.7% |
[ 2.5% - 3.0% ] 2.53% | 168,842 | 69.0% |
[ 2.5% - 3.0% ] 2.65% | 62,121 | 55.5% |
[ 2.5% - 3.0% ] 2.74% | 237,161 | 56.3% |
[ 2.5% - 3.0% ] 2.90% | 37,654 | 37.0% |
[ 2.5% - 3.0% ] 2.97% | 168,262 | 63.8% |
[ 3.0% - 3.5% ] 3.06% | 96,787 | 57.4% |
[ 3.0% - 3.5% ] 3.17% | 366,071 | 53.2% |
[ 3.0% - 3.5% ] 3.28% | 205,431 | 55.0% |
[ 3.0% - 3.5% ] 3.42% | 106,622 | 52.5% |
[ 3.5% - 4.0% ] 3.54% | 104,647 | 51.8% |
[ 3.5% - 4.0% ] 3.59% | 31,657 | 57.4% |
[ 3.5% - 4.0% ] 3.82% | 33,868 | 65.5% |
[ 3.5% - 4.0% ] 3.95% | 24,177 | 57.3% |
[ 4.0% - 4.5% ] 4.09% | 6,915 | 80.5% |
[ 4.0% - 4.5% ] 4.10% | 29,744 | 41.2% |
[ 4.0% - 4.5% ] 4.28% | 20,668 | 26.9% |
[ 4.0% - 4.5% ] 4.33% | 4,410 | 69.5% |
[ 4.0% - 4.5% ] 4.46% | 133,954 | 57.7% |
[ 4.5% - 5.0% ] 4.62% | 21,080 | 59.6% |
[ 4.5% - 5.0% ] 4.72% | 36,842 | 68.1% |
[ 4.5% - 5.0% ] 4.79% | 2,318 | 80.2% |
[ 4.5% - 5.0% ] 4.88% | 38,003 | 77.7% |
[ 4.5% - 5.0% ] 4.96% | 29,544 | 42.8% |
[ 5.0% - 5.5% ] 5.12% | 31,381 | 56.7% |
[ 5.0% - 5.5% ] 5.26% | 35,819 | 43.3% |
[ 5.0% - 5.5% ] 5.30% | 73,595 | 43.9% |
[ 5.0% - 5.5% ] 5.43% | 54,074 | 45.6% |
[ 5.5% - 6.0% ] 5.56% | 180 | 74.2% |
[ 6.0% - 6.5% ] 6.19% | 28,792 | 51.3% |
[ 6.5% - 7.0% ] 6.74% | 30,549 | 50.4% |
[ 6.5% - 7.0% ] 6.80% | 30,599 | 50.1% |
[ 7.0% - 7.5% ] 7.05% | 2,936 | 79.8% |
[ 7.0% - 7.5% ] 7.22% | 44,429 | 28.0% |
[ 7.5% - 8.0% ] 7.51% | 7,509 | 32.6% |
[ 7.5% - 8.0% ] 7.58% | 28,765 | 53.9% |
[ 7.5% - 8.0% ] 7.72% | 50,392 | 26.9% |
[ 8.0% - 8.5% ] 8.15% | 44,862 | 43.0% |
[ 8.5% - 9.0% ] 8.58% | 16,246 | 55.1% |
[ 9.0% - 9.5% ] 9.23% | 38,408 | 41.0% |
[ 9.5% - 10.0% ] 9.51% | 17,076 | 51.7% |
[ 9.5% - 10.0% ] 9.95% | 16,190 | 57.6% |
[ 10.0% - 10.5% ] 10.11% | 49,408 | 47.5% |
[ 10.5% - 11.0% ] 10.60% | 11,060 | 68.4% |
[ 10.5% - 11.0% ] 10.73% | 1,445 | 73.1% |
[ 11.0% - 11.5% ] 11.04% | 462 | 62.9% |
[ 11.0% - 11.5% ] 11.26% | 23,193 | 33.0% |
[ 11.0% - 11.5% ] 11.42% | 18,445 | 41.5% |
[ 12.0% - 12.5% ] 12.01% | 9,699 | 69.2% |
[ 12.5% - 13.0% ] 12.57% | 18,951 | 43.8% |
[ 13.0% - 13.5% ] 13.18% | 59,525 | 46.2% |
[ 13.0% - 13.5% ] 13.42% | 9,105 | 73.6% |
[ 13.5% - 14.0% ] 13.81% | 195,069 | 47.5% |
[ 14.5% - 15.0% ] 14.76% | 51,474 | 49.5% |
[ 15.0% - 15.5% ] 15.07% | 5,593 | 71.2% |
[ 15.0% - 15.5% ] 15.45% | 1,139 | 51.8% |
[ 16.0% - 16.5% ] 16.21% | 16,679 | 37.3% |
[ 16.5% - 17.0% ] 16.88% | 77 | 39.6% |
[ 18.0% - 18.5% ] 18.45% | 233 | 24.8% |
[ 18.5% - 19.0% ] 18.76% | 23,473 | 50.4% |
[ 20.0% - 20.5% ] 20.01% | 22,163 | 47.4% |
[ 20.5% - 21.0% ] 20.87% | 11,091 | 48.4% |
[ 21.5% - 22.0% ] 21.54% | 1,207 | 80.4% |
[ 67.0% - 67.5% ] 67.38% | 141 | 79.5% |