Immigrants from Iran Disability
COMPARE
Immigrants from Iran
Select to Compare
Disability
Immigrants from Iran Disability
10.3%
DISABILITY
100.0/ 100
METRIC RATING
17th/ 347
METRIC RANK
Immigrants from Iran Disability Correlation Chart
The statistical analysis conducted on geographies consisting of 279,897,593 people shows a strong positive correlation between the proportion of Immigrants from Iran and percentage of population with a disability in the United States with a correlation coefficient (R) of 0.787 and weighted average of 10.3%. On average, for every 1% (one percent) increase in Immigrants from Iran within a typical geography, there is an increase of 0.64% in percentage of population with a disability.
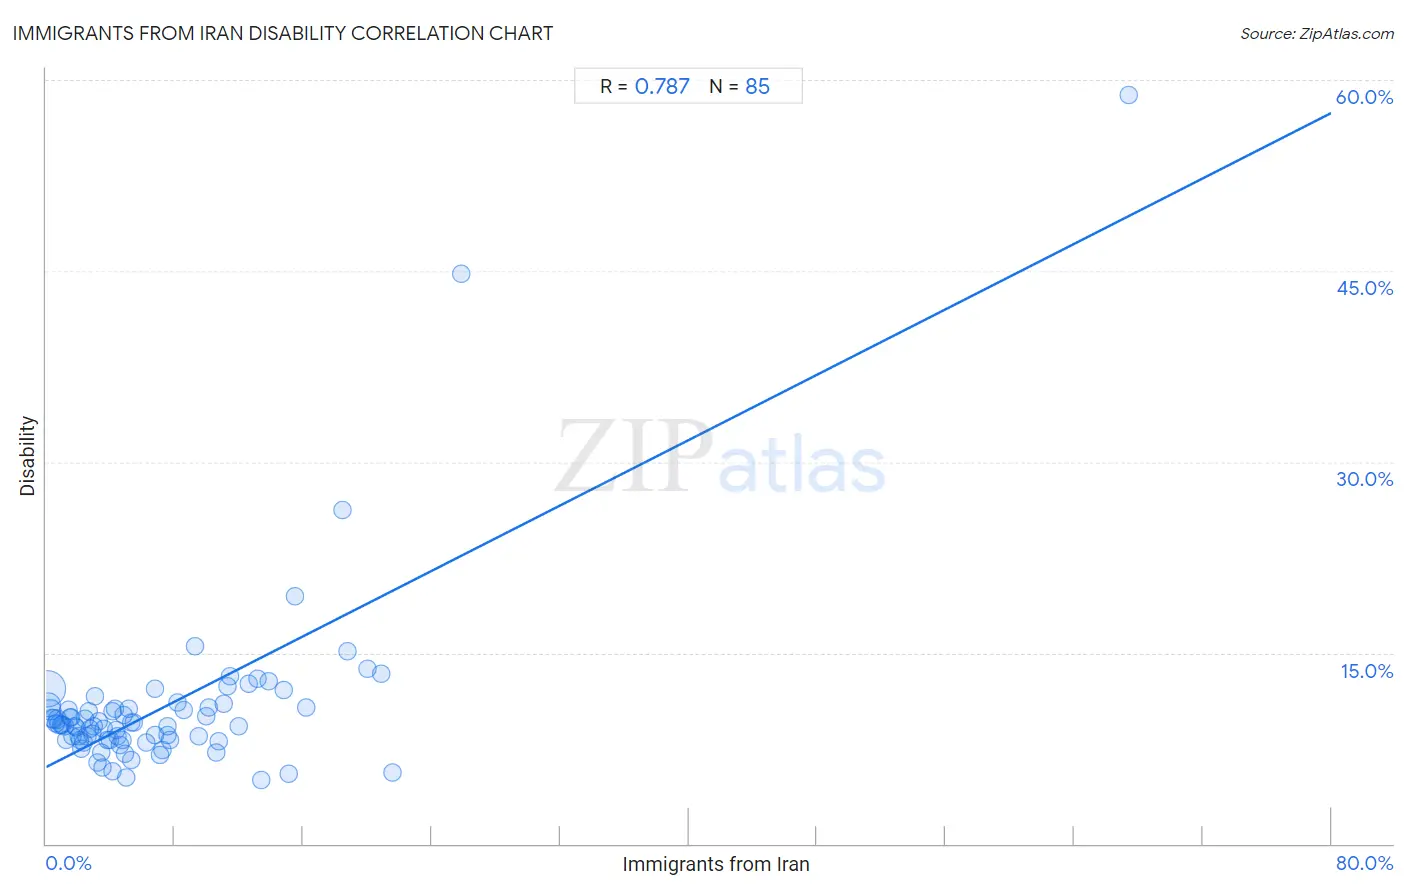
It is essential to understand that the correlation between the percentage of Immigrants from Iran and percentage of population with a disability does not imply a direct cause-and-effect relationship. It remains uncertain whether the presence of Immigrants from Iran influences an upward or downward trend in the level of percentage of population with a disability within an area, or if Immigrants from Iran simply ended up residing in those areas with higher or lower levels of percentage of population with a disability due to other factors.
Demographics Similar to Immigrants from Iran by Disability
In terms of disability, the demographic groups most similar to Immigrants from Iran are Indian (Asian) (10.3%, a difference of 0.070%), Okinawan (10.3%, a difference of 0.13%), Immigrants from Korea (10.2%, a difference of 0.44%), Burmese (10.4%, a difference of 0.99%), and Immigrants from Pakistan (10.4%, a difference of 0.99%).
| Demographics | Rating | Rank | Disability |
| Immigrants from China | 100.0 /100 | #10 | Exceptional 10.1% |
| Iranians | 100.0 /100 | #11 | Exceptional 10.1% |
| Immigrants from Israel | 100.0 /100 | #12 | Exceptional 10.1% |
| Immigrants from Eastern Asia | 100.0 /100 | #13 | Exceptional 10.2% |
| Immigrants from Korea | 100.0 /100 | #14 | Exceptional 10.2% |
| Okinawans | 100.0 /100 | #15 | Exceptional 10.3% |
| Indians (Asian) | 100.0 /100 | #16 | Exceptional 10.3% |
| Immigrants from Iran | 100.0 /100 | #17 | Exceptional 10.3% |
| Burmese | 100.0 /100 | #18 | Exceptional 10.4% |
| Immigrants from Pakistan | 100.0 /100 | #19 | Exceptional 10.4% |
| Immigrants from Venezuela | 100.0 /100 | #20 | Exceptional 10.4% |
| Asians | 100.0 /100 | #21 | Exceptional 10.4% |
| Immigrants from Sri Lanka | 100.0 /100 | #22 | Exceptional 10.5% |
| Immigrants from Asia | 100.0 /100 | #23 | Exceptional 10.5% |
| Venezuelans | 100.0 /100 | #24 | Exceptional 10.5% |
Immigrants from Iran Disability Correlation Summary
| Measurement | Immigrants from Iran Data | Disability Data |
| Minimum | 0.052% | 5.0% |
| Maximum | 67.4% | 58.9% |
| Range | 67.3% | 53.8% |
| Mean | 7.3% | 10.7% |
| Median | 4.7% | 9.3% |
| Interquartile 25% (IQ1) | 2.3% | 8.1% |
| Interquartile 75% (IQ3) | 10.4% | 10.7% |
| Interquartile Range (IQR) | 8.1% | 2.6% |
| Standard Deviation (Sample) | 8.8% | 7.2% |
| Standard Deviation (Population) | 8.7% | 7.1% |
Correlation Details
| Immigrants from Iran Percentile | Sample Size | Disability |
[ 0.0% - 0.5% ] 0.052% | 151,560,022 | 12.2% |
[ 0.0% - 0.5% ] 0.15% | 53,248,812 | 10.9% |
[ 0.0% - 0.5% ] 0.26% | 24,774,303 | 10.5% |
[ 0.0% - 0.5% ] 0.37% | 13,240,268 | 9.9% |
[ 0.0% - 0.5% ] 0.49% | 9,944,250 | 9.8% |
[ 0.5% - 1.0% ] 0.58% | 4,749,378 | 9.4% |
[ 0.5% - 1.0% ] 0.70% | 3,096,782 | 9.8% |
[ 0.5% - 1.0% ] 0.81% | 2,015,902 | 9.4% |
[ 0.5% - 1.0% ] 0.91% | 2,347,521 | 9.3% |
[ 1.0% - 1.5% ] 1.01% | 2,211,397 | 9.3% |
[ 1.0% - 1.5% ] 1.12% | 665,605 | 9.2% |
[ 1.0% - 1.5% ] 1.24% | 1,340,432 | 8.2% |
[ 1.0% - 1.5% ] 1.37% | 4,533,089 | 10.5% |
[ 1.0% - 1.5% ] 1.46% | 539,854 | 9.9% |
[ 1.5% - 2.0% ] 1.56% | 813,324 | 9.9% |
[ 1.5% - 2.0% ] 1.66% | 386,820 | 8.4% |
[ 1.5% - 2.0% ] 1.78% | 326,063 | 9.2% |
[ 1.5% - 2.0% ] 1.89% | 263,874 | 9.1% |
[ 1.5% - 2.0% ] 1.99% | 139,534 | 8.5% |
[ 2.0% - 2.5% ] 2.10% | 174,310 | 8.2% |
[ 2.0% - 2.5% ] 2.19% | 196,829 | 7.5% |
[ 2.0% - 2.5% ] 2.31% | 193,289 | 7.9% |
[ 2.0% - 2.5% ] 2.44% | 87,748 | 9.8% |
[ 2.5% - 3.0% ] 2.53% | 168,842 | 8.4% |
[ 2.5% - 3.0% ] 2.65% | 62,121 | 10.4% |
[ 2.5% - 3.0% ] 2.74% | 237,161 | 9.0% |
[ 2.5% - 3.0% ] 2.90% | 37,654 | 8.7% |
[ 2.5% - 3.0% ] 2.97% | 168,262 | 9.3% |
[ 3.0% - 3.5% ] 3.06% | 96,787 | 11.6% |
[ 3.0% - 3.5% ] 3.17% | 366,071 | 6.4% |
[ 3.0% - 3.5% ] 3.28% | 205,431 | 9.6% |
[ 3.0% - 3.5% ] 3.42% | 106,622 | 7.1% |
[ 3.5% - 4.0% ] 3.54% | 104,647 | 6.0% |
[ 3.5% - 4.0% ] 3.59% | 32,124 | 9.0% |
[ 3.5% - 4.0% ] 3.82% | 33,868 | 8.2% |
[ 3.5% - 4.0% ] 3.95% | 24,177 | 8.1% |
[ 4.0% - 4.5% ] 4.09% | 6,915 | 5.7% |
[ 4.0% - 4.5% ] 4.10% | 29,744 | 10.4% |
[ 4.0% - 4.5% ] 4.28% | 20,668 | 10.6% |
[ 4.0% - 4.5% ] 4.33% | 4,410 | 8.9% |
[ 4.0% - 4.5% ] 4.46% | 133,954 | 8.4% |
[ 4.5% - 5.0% ] 4.62% | 21,080 | 7.7% |
[ 4.5% - 5.0% ] 4.72% | 36,842 | 8.1% |
[ 4.5% - 5.0% ] 4.79% | 2,318 | 10.1% |
[ 4.5% - 5.0% ] 4.88% | 38,267 | 7.1% |
[ 4.5% - 5.0% ] 4.96% | 29,544 | 5.2% |
[ 5.0% - 5.5% ] 5.12% | 31,381 | 10.6% |
[ 5.0% - 5.5% ] 5.26% | 35,819 | 6.6% |
[ 5.0% - 5.5% ] 5.30% | 73,595 | 9.5% |
[ 5.0% - 5.5% ] 5.43% | 54,074 | 9.5% |
[ 6.0% - 6.5% ] 6.19% | 28,792 | 8.0% |
[ 6.5% - 7.0% ] 6.74% | 30,549 | 8.6% |
[ 6.5% - 7.0% ] 6.80% | 30,599 | 12.2% |
[ 7.0% - 7.5% ] 7.05% | 2,936 | 7.0% |
[ 7.0% - 7.5% ] 7.22% | 44,429 | 7.4% |
[ 7.5% - 8.0% ] 7.51% | 7,509 | 8.5% |
[ 7.5% - 8.0% ] 7.58% | 28,765 | 9.3% |
[ 7.5% - 8.0% ] 7.72% | 50,392 | 8.1% |
[ 8.0% - 8.5% ] 8.15% | 44,862 | 11.1% |
[ 8.5% - 9.0% ] 8.58% | 16,246 | 10.5% |
[ 9.0% - 9.5% ] 9.23% | 38,408 | 15.5% |
[ 9.5% - 10.0% ] 9.51% | 17,076 | 8.4% |
[ 9.5% - 10.0% ] 9.95% | 16,190 | 10.1% |
[ 10.0% - 10.5% ] 10.11% | 49,408 | 10.7% |
[ 10.5% - 11.0% ] 10.60% | 11,060 | 7.2% |
[ 10.5% - 11.0% ] 10.73% | 1,445 | 8.0% |
[ 11.0% - 11.5% ] 11.04% | 462 | 11.0% |
[ 11.0% - 11.5% ] 11.26% | 23,193 | 12.4% |
[ 11.0% - 11.5% ] 11.42% | 18,445 | 13.2% |
[ 12.0% - 12.5% ] 12.01% | 9,699 | 9.2% |
[ 12.5% - 13.0% ] 12.57% | 18,951 | 12.5% |
[ 13.0% - 13.5% ] 13.18% | 59,525 | 13.0% |
[ 13.0% - 13.5% ] 13.42% | 9,105 | 5.0% |
[ 13.5% - 14.0% ] 13.81% | 195,069 | 12.8% |
[ 14.5% - 15.0% ] 14.76% | 51,474 | 12.1% |
[ 15.0% - 15.5% ] 15.07% | 5,593 | 5.5% |
[ 15.0% - 15.5% ] 15.45% | 1,139 | 19.5% |
[ 16.0% - 16.5% ] 16.21% | 16,679 | 10.7% |
[ 18.0% - 18.5% ] 18.45% | 233 | 26.2% |
[ 18.5% - 19.0% ] 18.76% | 22,831 | 15.1% |
[ 20.0% - 20.5% ] 20.01% | 22,163 | 13.8% |
[ 20.5% - 21.0% ] 20.87% | 11,091 | 13.3% |
[ 21.5% - 22.0% ] 21.54% | 1,207 | 5.6% |
[ 25.5% - 26.0% ] 25.87% | 143 | 44.8% |
[ 67.0% - 67.5% ] 67.38% | 141 | 58.9% |