Immigrants from Iran Married-Couple Family Poverty
COMPARE
Immigrants from Iran
Select to Compare
Married-Couple Family Poverty
Immigrants from Iran Married-Couple Family Poverty
4.5%
POVERTY | MARRIED-COUPLE FAMILIES
99.0/ 100
METRIC RATING
79th/ 347
METRIC RANK
Immigrants from Iran Married-Couple Family Poverty Correlation Chart
The statistical analysis conducted on geographies consisting of 278,379,218 people shows a mild positive correlation between the proportion of Immigrants from Iran and poverty level among married-couple families in the United States with a correlation coefficient (R) of 0.388 and weighted average of 4.5%. On average, for every 1% (one percent) increase in Immigrants from Iran within a typical geography, there is an increase of 0.25% in poverty level among married-couple families.
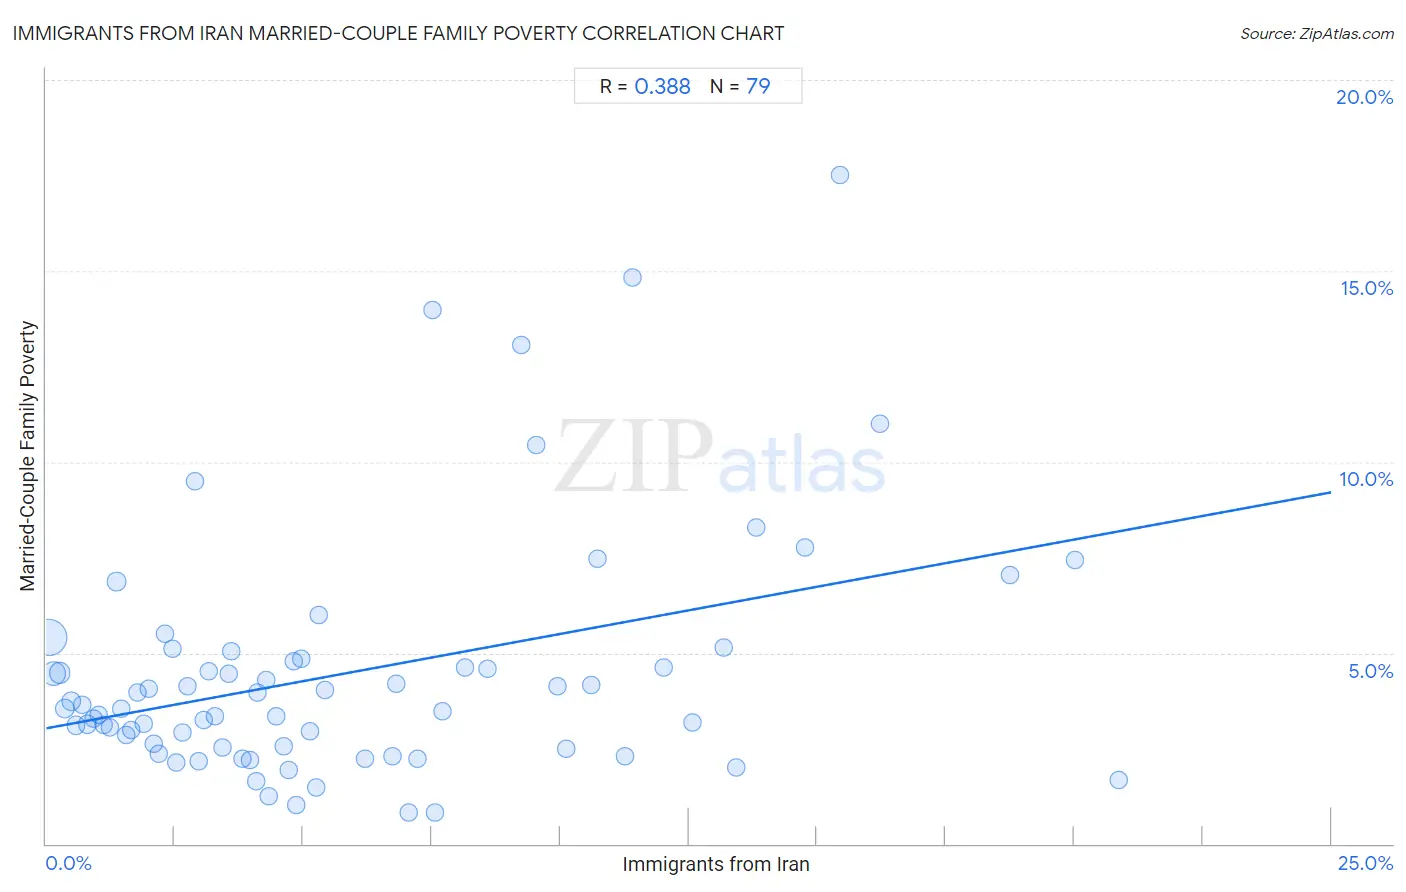
It is essential to understand that the correlation between the percentage of Immigrants from Iran and poverty level among married-couple families does not imply a direct cause-and-effect relationship. It remains uncertain whether the presence of Immigrants from Iran influences an upward or downward trend in the level of poverty level among married-couple families within an area, or if Immigrants from Iran simply ended up residing in those areas with higher or lower levels of poverty level among married-couple families due to other factors.
Demographics Similar to Immigrants from Iran by Married-Couple Family Poverty
In terms of married-couple family poverty, the demographic groups most similar to Immigrants from Iran are Icelander (4.5%, a difference of 0.060%), Immigrants from Greece (4.5%, a difference of 0.20%), Scotch-Irish (4.5%, a difference of 0.23%), Immigrants from Latvia (4.5%, a difference of 0.31%), and Canadian (4.5%, a difference of 0.45%).
| Demographics | Rating | Rank | Married-Couple Family Poverty |
| Immigrants from England | 99.3 /100 | #72 | Exceptional 4.5% |
| Ukrainians | 99.2 /100 | #73 | Exceptional 4.5% |
| Immigrants from Austria | 99.2 /100 | #74 | Exceptional 4.5% |
| Cambodians | 99.2 /100 | #75 | Exceptional 4.5% |
| Immigrants from South Africa | 99.1 /100 | #76 | Exceptional 4.5% |
| Immigrants from Latvia | 99.1 /100 | #77 | Exceptional 4.5% |
| Scotch-Irish | 99.1 /100 | #78 | Exceptional 4.5% |
| Immigrants from Iran | 99.0 /100 | #79 | Exceptional 4.5% |
| Icelanders | 99.0 /100 | #80 | Exceptional 4.5% |
| Immigrants from Greece | 98.9 /100 | #81 | Exceptional 4.5% |
| Canadians | 98.8 /100 | #82 | Exceptional 4.5% |
| Immigrants from Denmark | 98.8 /100 | #83 | Exceptional 4.6% |
| Immigrants from Croatia | 98.7 /100 | #84 | Exceptional 4.6% |
| South Africans | 98.7 /100 | #85 | Exceptional 4.6% |
| Immigrants from Turkey | 98.6 /100 | #86 | Exceptional 4.6% |
Immigrants from Iran Married-Couple Family Poverty Correlation Summary
| Measurement | Immigrants from Iran Data | Married-Couple Family Poverty Data |
| Minimum | 0.052% | 0.82% |
| Maximum | 20.9% | 17.5% |
| Range | 20.8% | 16.7% |
| Mean | 5.9% | 4.5% |
| Median | 4.3% | 3.5% |
| Interquartile 25% (IQ1) | 2.1% | 2.5% |
| Interquartile 75% (IQ3) | 8.6% | 4.9% |
| Interquartile Range (IQR) | 6.5% | 2.3% |
| Standard Deviation (Sample) | 5.0% | 3.2% |
| Standard Deviation (Population) | 5.0% | 3.2% |
Correlation Details
| Immigrants from Iran Percentile | Sample Size | Married-Couple Family Poverty |
[ 0.0% - 0.5% ] 0.052% | 151,362,046 | 5.4% |
[ 0.0% - 0.5% ] 0.15% | 52,991,535 | 4.5% |
[ 0.0% - 0.5% ] 0.26% | 24,459,838 | 4.5% |
[ 0.0% - 0.5% ] 0.37% | 13,077,796 | 3.5% |
[ 0.0% - 0.5% ] 0.49% | 9,821,886 | 3.7% |
[ 0.5% - 1.0% ] 0.58% | 4,672,929 | 3.1% |
[ 0.5% - 1.0% ] 0.70% | 3,002,226 | 3.6% |
[ 0.5% - 1.0% ] 0.81% | 1,980,639 | 3.1% |
[ 0.5% - 1.0% ] 0.91% | 2,329,059 | 3.3% |
[ 1.0% - 1.5% ] 1.01% | 2,189,771 | 3.4% |
[ 1.0% - 1.5% ] 1.13% | 637,535 | 3.1% |
[ 1.0% - 1.5% ] 1.24% | 1,297,154 | 3.1% |
[ 1.0% - 1.5% ] 1.37% | 4,523,880 | 6.9% |
[ 1.0% - 1.5% ] 1.46% | 538,184 | 3.5% |
[ 1.5% - 2.0% ] 1.56% | 797,743 | 2.8% |
[ 1.5% - 2.0% ] 1.66% | 380,946 | 3.0% |
[ 1.5% - 2.0% ] 1.78% | 311,873 | 4.0% |
[ 1.5% - 2.0% ] 1.89% | 262,166 | 3.2% |
[ 1.5% - 2.0% ] 1.99% | 135,034 | 4.1% |
[ 2.0% - 2.5% ] 2.10% | 163,472 | 2.6% |
[ 2.0% - 2.5% ] 2.19% | 195,929 | 2.4% |
[ 2.0% - 2.5% ] 2.31% | 182,024 | 5.5% |
[ 2.0% - 2.5% ] 2.44% | 79,613 | 5.1% |
[ 2.5% - 3.0% ] 2.53% | 166,612 | 2.1% |
[ 2.5% - 3.0% ] 2.65% | 62,121 | 2.9% |
[ 2.5% - 3.0% ] 2.74% | 230,489 | 4.1% |
[ 2.5% - 3.0% ] 2.90% | 35,710 | 9.5% |
[ 2.5% - 3.0% ] 2.97% | 166,645 | 2.2% |
[ 3.0% - 3.5% ] 3.06% | 94,216 | 3.2% |
[ 3.0% - 3.5% ] 3.17% | 355,288 | 4.5% |
[ 3.0% - 3.5% ] 3.28% | 204,760 | 3.3% |
[ 3.0% - 3.5% ] 3.42% | 105,514 | 2.5% |
[ 3.5% - 4.0% ] 3.54% | 102,143 | 4.4% |
[ 3.5% - 4.0% ] 3.59% | 31,657 | 5.0% |
[ 3.5% - 4.0% ] 3.82% | 33,292 | 2.2% |
[ 3.5% - 4.0% ] 3.96% | 23,223 | 2.2% |
[ 4.0% - 4.5% ] 4.09% | 6,915 | 1.6% |
[ 4.0% - 4.5% ] 4.10% | 27,348 | 4.0% |
[ 4.0% - 4.5% ] 4.28% | 20,411 | 4.3% |
[ 4.0% - 4.5% ] 4.33% | 4,410 | 1.2% |
[ 4.0% - 4.5% ] 4.46% | 132,790 | 3.3% |
[ 4.5% - 5.0% ] 4.62% | 21,080 | 2.5% |
[ 4.5% - 5.0% ] 4.72% | 36,842 | 1.9% |
[ 4.5% - 5.0% ] 4.81% | 1,350 | 4.8% |
[ 4.5% - 5.0% ] 4.88% | 38,003 | 1.0% |
[ 4.5% - 5.0% ] 4.96% | 29,544 | 4.9% |
[ 5.0% - 5.5% ] 5.12% | 31,381 | 3.0% |
[ 5.0% - 5.5% ] 5.26% | 35,819 | 1.5% |
[ 5.0% - 5.5% ] 5.30% | 73,595 | 6.0% |
[ 5.0% - 5.5% ] 5.43% | 54,074 | 4.0% |
[ 6.0% - 6.5% ] 6.19% | 28,792 | 2.2% |
[ 6.5% - 7.0% ] 6.74% | 23,106 | 2.3% |
[ 6.5% - 7.0% ] 6.80% | 30,599 | 4.2% |
[ 7.0% - 7.5% ] 7.05% | 2,936 | 0.82% |
[ 7.0% - 7.5% ] 7.22% | 44,429 | 2.2% |
[ 7.5% - 8.0% ] 7.51% | 7,509 | 14.0% |
[ 7.5% - 8.0% ] 7.58% | 28,765 | 0.83% |
[ 7.5% - 8.0% ] 7.72% | 50,392 | 3.5% |
[ 8.0% - 8.5% ] 8.15% | 44,862 | 4.6% |
[ 8.5% - 9.0% ] 8.58% | 16,246 | 4.6% |
[ 9.0% - 9.5% ] 9.24% | 35,755 | 13.1% |
[ 9.5% - 10.0% ] 9.54% | 9,208 | 10.4% |
[ 9.5% - 10.0% ] 9.95% | 16,190 | 4.1% |
[ 10.0% - 10.5% ] 10.11% | 49,408 | 2.5% |
[ 10.5% - 11.0% ] 10.60% | 11,060 | 4.2% |
[ 10.5% - 11.0% ] 10.73% | 1,445 | 7.5% |
[ 11.0% - 11.5% ] 11.26% | 23,193 | 2.3% |
[ 11.0% - 11.5% ] 11.42% | 18,445 | 14.8% |
[ 12.0% - 12.5% ] 12.01% | 9,699 | 4.6% |
[ 12.5% - 13.0% ] 12.57% | 18,951 | 3.2% |
[ 13.0% - 13.5% ] 13.18% | 59,525 | 5.1% |
[ 13.0% - 13.5% ] 13.42% | 9,105 | 2.0% |
[ 13.5% - 14.0% ] 13.81% | 195,069 | 8.3% |
[ 14.5% - 15.0% ] 14.76% | 51,474 | 7.8% |
[ 15.0% - 15.5% ] 15.45% | 1,139 | 17.5% |
[ 16.0% - 16.5% ] 16.21% | 16,679 | 11.0% |
[ 18.5% - 19.0% ] 18.76% | 23,473 | 7.0% |
[ 20.0% - 20.5% ] 20.01% | 22,163 | 7.4% |
[ 20.5% - 21.0% ] 20.87% | 11,091 | 1.7% |