Immigrants from Europe GED/Equivalency
COMPARE
Immigrants from Europe
Select to Compare
GED/Equivalency
Immigrants from Europe GED/Equivalency
87.5%
GED/EQUIVALENCY
98.1/ 100
METRIC RATING
86th/ 347
METRIC RANK
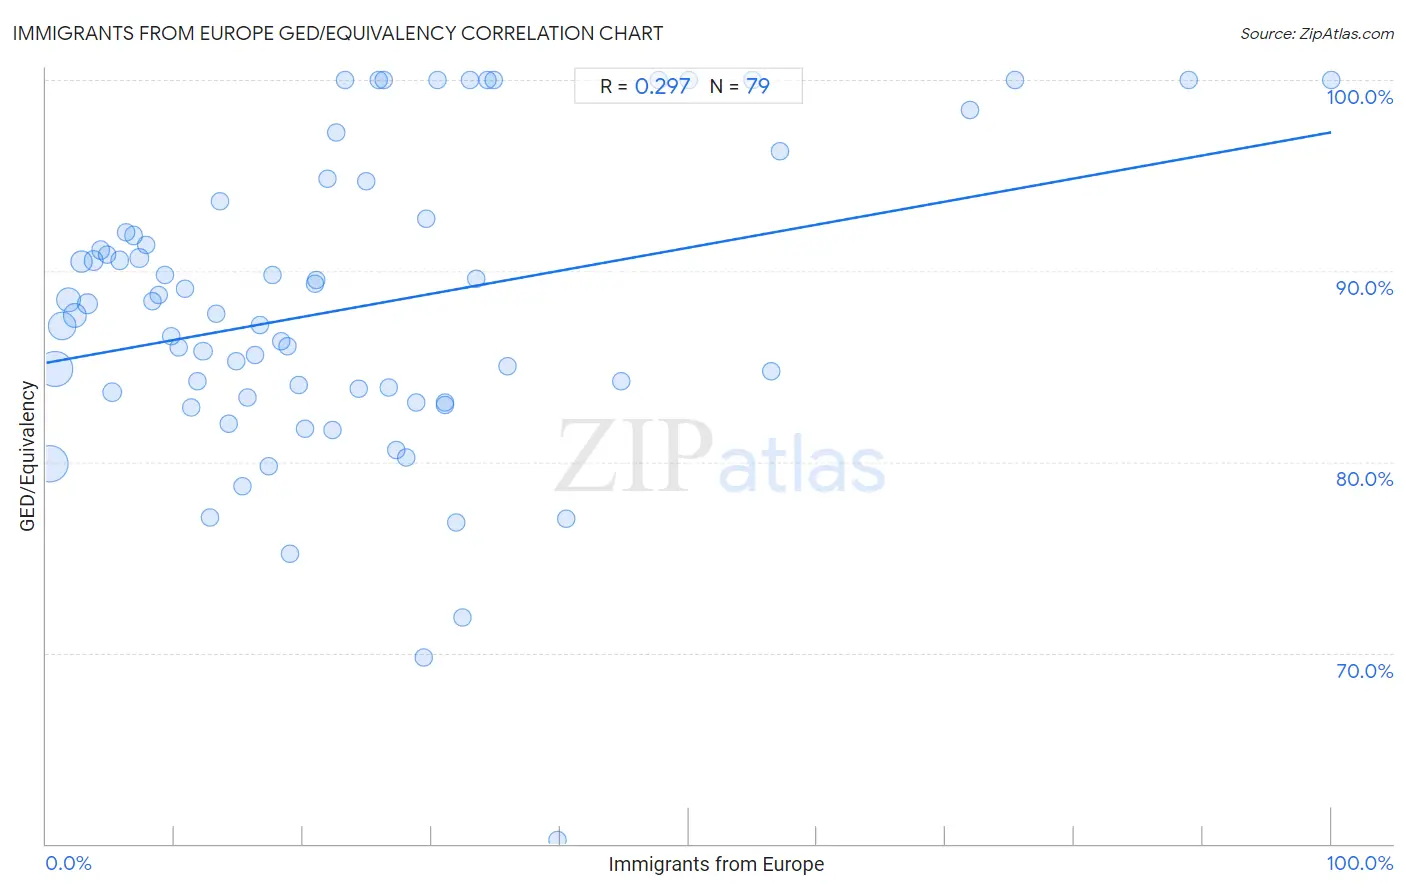
Immigrants from Europe GED/Equivalency Correlation Chart
The statistical analysis conducted on geographies consisting of 547,425,948 people shows a weak positive correlation between the proportion of Immigrants from Europe and percentage of population with at least ged/equivalency education in the United States with a correlation coefficient (R) of 0.297 and weighted average of 87.5%. On average, for every 1% (one percent) increase in Immigrants from Europe within a typical geography, there is an increase of 0.12% in percentage of population with at least ged/equivalency education.
It is essential to understand that the correlation between the percentage of Immigrants from Europe and percentage of population with at least ged/equivalency education does not imply a direct cause-and-effect relationship. It remains uncertain whether the presence of Immigrants from Europe influences an upward or downward trend in the level of percentage of population with at least ged/equivalency education within an area, or if Immigrants from Europe simply ended up residing in those areas with higher or lower levels of percentage of population with at least ged/equivalency education due to other factors.
Demographics Similar to Immigrants from Europe by GED/Equivalency
In terms of ged/equivalency, the demographic groups most similar to Immigrants from Europe are Native Hawaiian (87.5%, a difference of 0.0%), Immigrants from Romania (87.5%, a difference of 0.010%), Dutch (87.5%, a difference of 0.010%), Immigrants from Norway (87.5%, a difference of 0.010%), and South African (87.5%, a difference of 0.050%).
| Demographics | Rating | Rank | GED/Equivalency |
| English | 98.6 /100 | #79 | Exceptional 87.6% |
| Immigrants from England | 98.5 /100 | #80 | Exceptional 87.6% |
| Immigrants from Sri Lanka | 98.3 /100 | #81 | Exceptional 87.5% |
| Romanians | 98.3 /100 | #82 | Exceptional 87.5% |
| South Africans | 98.3 /100 | #83 | Exceptional 87.5% |
| Immigrants from Romania | 98.1 /100 | #84 | Exceptional 87.5% |
| Dutch | 98.1 /100 | #85 | Exceptional 87.5% |
| Immigrants from Europe | 98.1 /100 | #86 | Exceptional 87.5% |
| Native Hawaiians | 98.1 /100 | #87 | Exceptional 87.5% |
| Immigrants from Norway | 98.1 /100 | #88 | Exceptional 87.5% |
| Hungarians | 97.9 /100 | #89 | Exceptional 87.4% |
| Welsh | 97.9 /100 | #90 | Exceptional 87.4% |
| Immigrants from Eastern Asia | 97.9 /100 | #91 | Exceptional 87.4% |
| Israelis | 97.8 /100 | #92 | Exceptional 87.4% |
| Immigrants from North Macedonia | 97.8 /100 | #93 | Exceptional 87.4% |
Immigrants from Europe GED/Equivalency Correlation Summary
| Measurement | Immigrants from Europe Data | GED/Equivalency Data |
| Minimum | 0.26% | 60.2% |
| Maximum | 100.0% | 100.0% |
| Range | 99.7% | 39.8% |
| Mean | 23.8% | 88.1% |
| Median | 19.7% | 87.8% |
| Interquartile 25% (IQ1) | 9.8% | 83.4% |
| Interquartile 75% (IQ3) | 31.1% | 92.7% |
| Interquartile Range (IQR) | 21.3% | 9.3% |
| Standard Deviation (Sample) | 19.7% | 8.0% |
| Standard Deviation (Population) | 19.6% | 8.0% |
Correlation Details
| Immigrants from Europe Percentile | Sample Size | GED/Equivalency |
[ 0.0% - 0.5% ] 0.26% | 143,144,755 | 79.9% |
[ 0.5% - 1.0% ] 0.72% | 130,016,682 | 84.9% |
[ 1.0% - 1.5% ] 1.24% | 81,476,473 | 87.1% |
[ 1.5% - 2.0% ] 1.72% | 51,060,697 | 88.5% |
[ 2.0% - 2.5% ] 2.25% | 40,440,003 | 87.7% |
[ 2.5% - 3.0% ] 2.74% | 23,874,862 | 90.5% |
[ 3.0% - 3.5% ] 3.25% | 18,900,124 | 88.3% |
[ 3.5% - 4.0% ] 3.73% | 10,721,736 | 90.5% |
[ 4.0% - 4.5% ] 4.24% | 8,543,304 | 91.1% |
[ 4.5% - 5.0% ] 4.73% | 5,706,089 | 90.9% |
[ 5.0% - 5.5% ] 5.13% | 14,324,901 | 83.6% |
[ 5.5% - 6.0% ] 5.74% | 4,172,495 | 90.6% |
[ 6.0% - 6.5% ] 6.24% | 2,768,386 | 92.0% |
[ 6.5% - 7.0% ] 6.76% | 2,544,275 | 91.9% |
[ 7.0% - 7.5% ] 7.23% | 1,482,140 | 90.7% |
[ 7.5% - 8.0% ] 7.74% | 1,273,308 | 91.4% |
[ 8.0% - 8.5% ] 8.27% | 958,797 | 88.4% |
[ 8.5% - 9.0% ] 8.71% | 840,020 | 88.7% |
[ 9.0% - 9.5% ] 9.26% | 808,269 | 89.8% |
[ 9.5% - 10.0% ] 9.75% | 493,983 | 86.6% |
[ 10.0% - 10.5% ] 10.28% | 643,437 | 86.0% |
[ 10.5% - 11.0% ] 10.76% | 112,543 | 89.0% |
[ 11.0% - 11.5% ] 11.30% | 312,700 | 82.8% |
[ 11.5% - 12.0% ] 11.77% | 493,330 | 84.2% |
[ 12.0% - 12.5% ] 12.21% | 409,157 | 85.8% |
[ 12.5% - 13.0% ] 12.73% | 181,419 | 77.1% |
[ 13.0% - 13.5% ] 13.21% | 289,387 | 87.8% |
[ 13.5% - 14.0% ] 13.55% | 125,399 | 93.7% |
[ 14.0% - 14.5% ] 14.19% | 237,268 | 82.0% |
[ 14.5% - 15.0% ] 14.80% | 140,327 | 85.3% |
[ 15.0% - 15.5% ] 15.30% | 239,636 | 78.7% |
[ 15.5% - 16.0% ] 15.71% | 39,842 | 83.4% |
[ 16.0% - 16.5% ] 16.25% | 58,439 | 85.6% |
[ 16.5% - 17.0% ] 16.68% | 122,288 | 87.2% |
[ 17.0% - 17.5% ] 17.35% | 83,241 | 79.8% |
[ 17.5% - 18.0% ] 17.64% | 2,869 | 89.8% |
[ 18.0% - 18.5% ] 18.24% | 38,098 | 86.3% |
[ 18.5% - 19.0% ] 18.77% | 3,911 | 86.1% |
[ 19.0% - 19.5% ] 19.01% | 142 | 75.2% |
[ 19.5% - 20.0% ] 19.66% | 2,431 | 84.0% |
[ 20.0% - 20.5% ] 20.18% | 65,907 | 81.7% |
[ 20.5% - 21.0% ] 20.89% | 675 | 89.4% |
[ 21.0% - 21.5% ] 21.06% | 30,714 | 89.5% |
[ 21.5% - 22.0% ] 21.84% | 2,289 | 94.8% |
[ 22.0% - 22.5% ] 22.30% | 2,049 | 81.7% |
[ 22.5% - 23.0% ] 22.53% | 648 | 97.3% |
[ 23.0% - 23.5% ] 23.28% | 799 | 100.0% |
[ 24.0% - 24.5% ] 24.31% | 469 | 83.8% |
[ 24.5% - 25.0% ] 24.95% | 473 | 94.7% |
[ 25.5% - 26.0% ] 25.83% | 391 | 100.0% |
[ 26.0% - 26.5% ] 26.24% | 202 | 100.0% |
[ 26.5% - 27.0% ] 26.65% | 17,166 | 83.9% |
[ 27.0% - 27.5% ] 27.26% | 72,291 | 80.6% |
[ 28.0% - 28.5% ] 28.03% | 23,288 | 80.2% |
[ 28.5% - 29.0% ] 28.80% | 8,963 | 83.1% |
[ 29.0% - 29.5% ] 29.41% | 238 | 69.7% |
[ 29.5% - 30.0% ] 29.60% | 402 | 92.7% |
[ 30.0% - 30.5% ] 30.43% | 46 | 100.0% |
[ 30.5% - 31.0% ] 30.99% | 71 | 83.1% |
[ 31.0% - 31.5% ] 31.06% | 483 | 83.0% |
[ 31.5% - 32.0% ] 31.88% | 69 | 76.8% |
[ 32.0% - 32.5% ] 32.43% | 37 | 71.9% |
[ 32.5% - 33.0% ] 32.93% | 249 | 100.0% |
[ 33.0% - 33.5% ] 33.42% | 25,808 | 89.6% |
[ 34.0% - 34.5% ] 34.34% | 332 | 100.0% |
[ 34.5% - 35.0% ] 34.78% | 207 | 100.0% |
[ 35.5% - 36.0% ] 35.90% | 83,069 | 85.0% |
[ 39.5% - 40.0% ] 39.78% | 93 | 60.2% |
[ 40.5% - 41.0% ] 40.51% | 274 | 77.0% |
[ 44.5% - 45.0% ] 44.74% | 38 | 84.2% |
[ 47.5% - 48.0% ] 47.69% | 65 | 100.0% |
[ 50.0% - 50.5% ] 50.00% | 54 | 100.0% |
[ 55.0% - 55.5% ] 55.00% | 20 | 100.0% |
[ 56.0% - 56.5% ] 56.39% | 321 | 84.7% |
[ 57.0% - 57.5% ] 57.14% | 133 | 96.2% |
[ 71.5% - 72.0% ] 71.88% | 128 | 98.4% |
[ 75.0% - 75.5% ] 75.42% | 240 | 100.0% |
[ 88.5% - 89.0% ] 88.89% | 27 | 100.0% |
[ 99.5% - 100.0% ] 100.00% | 57 | 100.0% |