Immigrants from Europe 4 or more Vehicles in Household
COMPARE
Immigrants from Europe
Select to Compare
4 or more Vehicles in Household
Immigrants from Europe 4 or more Vehicles in Household
5.7%
4+ VEHICLES AVAILABLE
2.3/ 100
METRIC RATING
250th/ 347
METRIC RANK
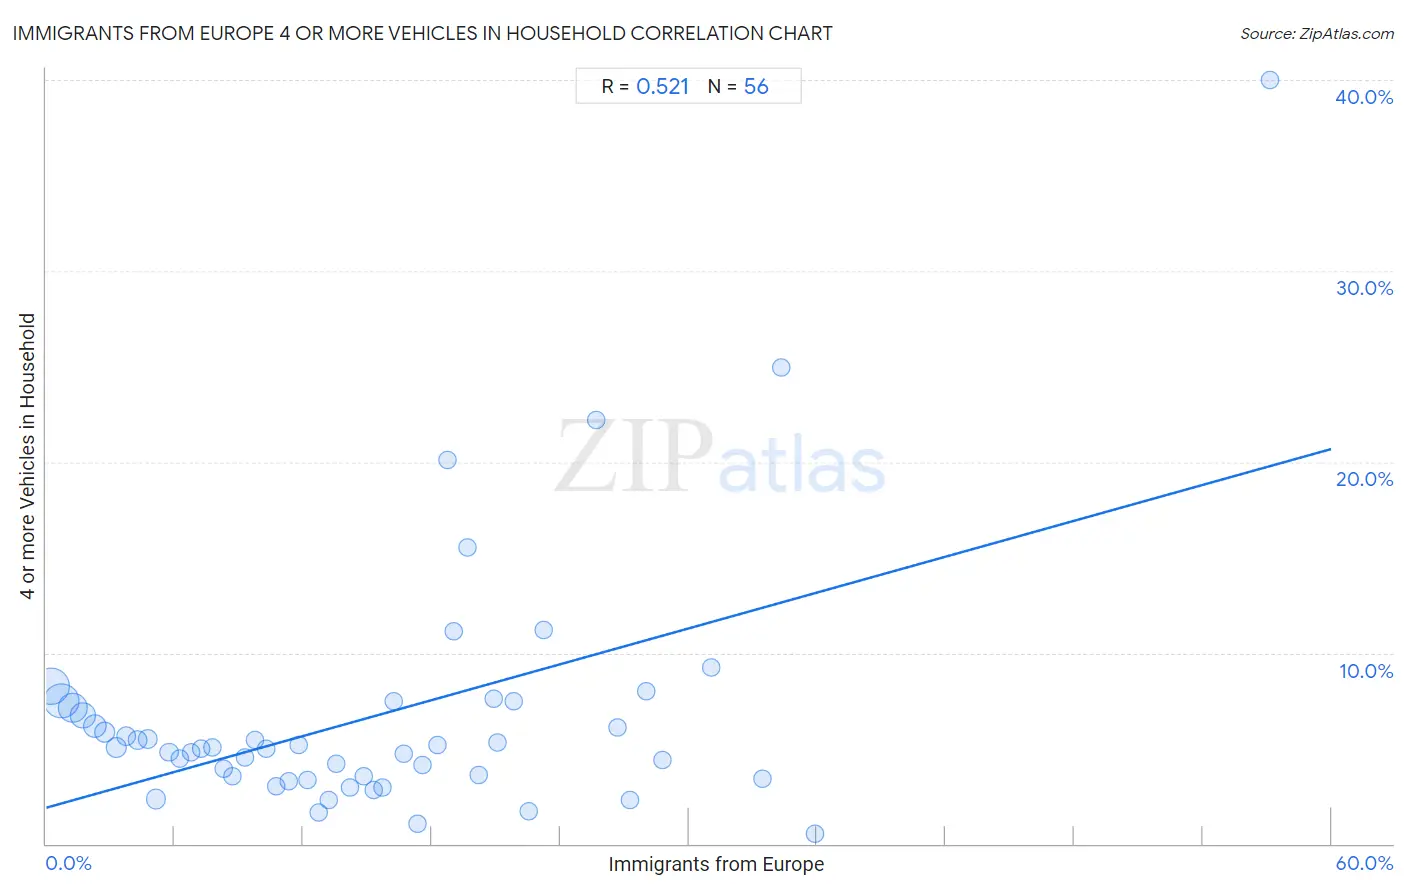
Immigrants from Europe 4 or more Vehicles in Household Correlation Chart
The statistical analysis conducted on geographies consisting of 544,257,144 people shows a substantial positive correlation between the proportion of Immigrants from Europe and percentage of households with 4 or more vehicles available in the United States with a correlation coefficient (R) of 0.521 and weighted average of 5.7%. On average, for every 1% (one percent) increase in Immigrants from Europe within a typical geography, there is an increase of 0.31% in percentage of households with 4 or more vehicles available.
It is essential to understand that the correlation between the percentage of Immigrants from Europe and percentage of households with 4 or more vehicles available does not imply a direct cause-and-effect relationship. It remains uncertain whether the presence of Immigrants from Europe influences an upward or downward trend in the level of percentage of households with 4 or more vehicles available within an area, or if Immigrants from Europe simply ended up residing in those areas with higher or lower levels of percentage of households with 4 or more vehicles available due to other factors.
Demographics Similar to Immigrants from Europe by 4 or more Vehicles in Household
In terms of 4 or more vehicles in household, the demographic groups most similar to Immigrants from Europe are Ugandan (5.7%, a difference of 0.020%), Immigrants from Southern Europe (5.7%, a difference of 0.10%), Immigrants from Eastern Africa (5.7%, a difference of 0.12%), Immigrants from Ethiopia (5.7%, a difference of 0.23%), and Subsaharan African (5.7%, a difference of 0.25%).
| Demographics | Rating | Rank | 4 or more Vehicles in Household |
| Immigrants from Czechoslovakia | 3.2 /100 | #243 | Tragic 5.8% |
| Ethiopians | 3.2 /100 | #244 | Tragic 5.8% |
| Bulgarians | 3.1 /100 | #245 | Tragic 5.8% |
| Immigrants from North Macedonia | 2.5 /100 | #246 | Tragic 5.7% |
| Immigrants from Ethiopia | 2.4 /100 | #247 | Tragic 5.7% |
| Immigrants from Eastern Africa | 2.4 /100 | #248 | Tragic 5.7% |
| Immigrants from Southern Europe | 2.3 /100 | #249 | Tragic 5.7% |
| Immigrants from Europe | 2.3 /100 | #250 | Tragic 5.7% |
| Ugandans | 2.2 /100 | #251 | Tragic 5.7% |
| Sub-Saharan Africans | 2.1 /100 | #252 | Tragic 5.7% |
| Immigrants from Cuba | 1.6 /100 | #253 | Tragic 5.7% |
| Immigrants from Panama | 1.5 /100 | #254 | Tragic 5.7% |
| Yup'ik | 1.5 /100 | #255 | Tragic 5.7% |
| Immigrants from Turkey | 1.5 /100 | #256 | Tragic 5.7% |
| Immigrants from Northern Africa | 1.4 /100 | #257 | Tragic 5.6% |
Immigrants from Europe 4 or more Vehicles in Household Correlation Summary
| Measurement | Immigrants from Europe Data | 4 or more Vehicles in Household Data |
| Minimum | 0.26% | 0.50% |
| Maximum | 57.1% | 40.0% |
| Range | 56.9% | 39.5% |
| Mean | 15.3% | 6.7% |
| Median | 13.9% | 5.0% |
| Interquartile 25% (IQ1) | 7.0% | 3.5% |
| Interquartile 75% (IQ3) | 21.0% | 7.3% |
| Interquartile Range (IQR) | 14.0% | 3.8% |
| Standard Deviation (Sample) | 10.9% | 6.6% |
| Standard Deviation (Population) | 10.8% | 6.5% |
Correlation Details
| Immigrants from Europe Percentile | Sample Size | 4 or more Vehicles in Household |
[ 0.0% - 0.5% ] 0.26% | 142,597,942 | 8.3% |
[ 0.5% - 1.0% ] 0.72% | 129,550,759 | 7.5% |
[ 1.0% - 1.5% ] 1.24% | 81,108,743 | 7.1% |
[ 1.5% - 2.0% ] 1.72% | 50,851,307 | 6.7% |
[ 2.0% - 2.5% ] 2.25% | 40,253,919 | 6.2% |
[ 2.5% - 3.0% ] 2.74% | 23,649,469 | 5.8% |
[ 3.0% - 3.5% ] 3.25% | 18,665,774 | 5.0% |
[ 3.5% - 4.0% ] 3.73% | 10,582,480 | 5.7% |
[ 4.0% - 4.5% ] 4.24% | 8,495,885 | 5.4% |
[ 4.5% - 5.0% ] 4.73% | 5,599,501 | 5.5% |
[ 5.0% - 5.5% ] 5.13% | 14,275,474 | 2.3% |
[ 5.5% - 6.0% ] 5.74% | 4,164,731 | 4.8% |
[ 6.0% - 6.5% ] 6.24% | 2,722,007 | 4.5% |
[ 6.5% - 7.0% ] 6.76% | 2,390,013 | 4.8% |
[ 7.0% - 7.5% ] 7.23% | 1,442,738 | 5.0% |
[ 7.5% - 8.0% ] 7.74% | 1,254,358 | 5.0% |
[ 8.0% - 8.5% ] 8.27% | 886,697 | 3.9% |
[ 8.5% - 9.0% ] 8.72% | 828,188 | 3.5% |
[ 9.0% - 9.5% ] 9.28% | 729,684 | 4.5% |
[ 9.5% - 10.0% ] 9.74% | 391,040 | 5.4% |
[ 10.0% - 10.5% ] 10.28% | 638,779 | 5.0% |
[ 10.5% - 11.0% ] 10.76% | 110,036 | 3.0% |
[ 11.0% - 11.5% ] 11.30% | 310,644 | 3.3% |
[ 11.5% - 12.0% ] 11.78% | 478,754 | 5.2% |
[ 12.0% - 12.5% ] 12.21% | 406,895 | 3.3% |
[ 12.5% - 13.0% ] 12.74% | 179,611 | 1.7% |
[ 13.0% - 13.5% ] 13.21% | 287,441 | 2.3% |
[ 13.5% - 14.0% ] 13.55% | 124,054 | 4.2% |
[ 14.0% - 14.5% ] 14.19% | 230,414 | 3.0% |
[ 14.5% - 15.0% ] 14.80% | 140,191 | 3.5% |
[ 15.0% - 15.5% ] 15.30% | 237,814 | 2.8% |
[ 15.5% - 16.0% ] 15.71% | 39,842 | 2.9% |
[ 16.0% - 16.5% ] 16.24% | 53,131 | 7.4% |
[ 16.5% - 17.0% ] 16.68% | 121,510 | 4.7% |
[ 17.0% - 17.5% ] 17.35% | 83,241 | 1.0% |
[ 17.5% - 18.0% ] 17.56% | 2,119 | 4.1% |
[ 18.0% - 18.5% ] 18.25% | 37,084 | 5.2% |
[ 18.5% - 19.0% ] 18.74% | 870 | 20.1% |
[ 19.0% - 19.5% ] 19.01% | 142 | 11.1% |
[ 19.5% - 20.0% ] 19.66% | 2,401 | 15.5% |
[ 20.0% - 20.5% ] 20.18% | 65,774 | 3.6% |
[ 20.5% - 21.0% ] 20.91% | 397 | 7.6% |
[ 21.0% - 21.5% ] 21.06% | 30,524 | 5.3% |
[ 21.5% - 22.0% ] 21.84% | 2,289 | 7.5% |
[ 22.5% - 23.0% ] 22.53% | 648 | 1.7% |
[ 23.0% - 23.5% ] 23.22% | 577 | 11.2% |
[ 25.5% - 26.0% ] 25.66% | 152 | 22.2% |
[ 26.5% - 27.0% ] 26.65% | 17,166 | 6.1% |
[ 27.0% - 27.5% ] 27.26% | 72,126 | 2.3% |
[ 28.0% - 28.5% ] 28.03% | 23,200 | 8.0% |
[ 28.5% - 29.0% ] 28.80% | 8,942 | 4.4% |
[ 31.0% - 31.5% ] 31.05% | 467 | 9.2% |
[ 33.0% - 33.5% ] 33.42% | 25,666 | 3.4% |
[ 34.0% - 34.5% ] 34.34% | 332 | 25.0% |
[ 35.5% - 36.0% ] 35.90% | 83,069 | 0.50% |
[ 57.0% - 57.5% ] 57.14% | 133 | 40.0% |