Immigrants from Europe Self-Care Disability
COMPARE
Immigrants from Europe
Select to Compare
Self-Care Disability
Immigrants from Europe Self-Care Disability
2.4%
SELF-CARE DISABILITY
69.6/ 100
METRIC RATING
157th/ 347
METRIC RANK
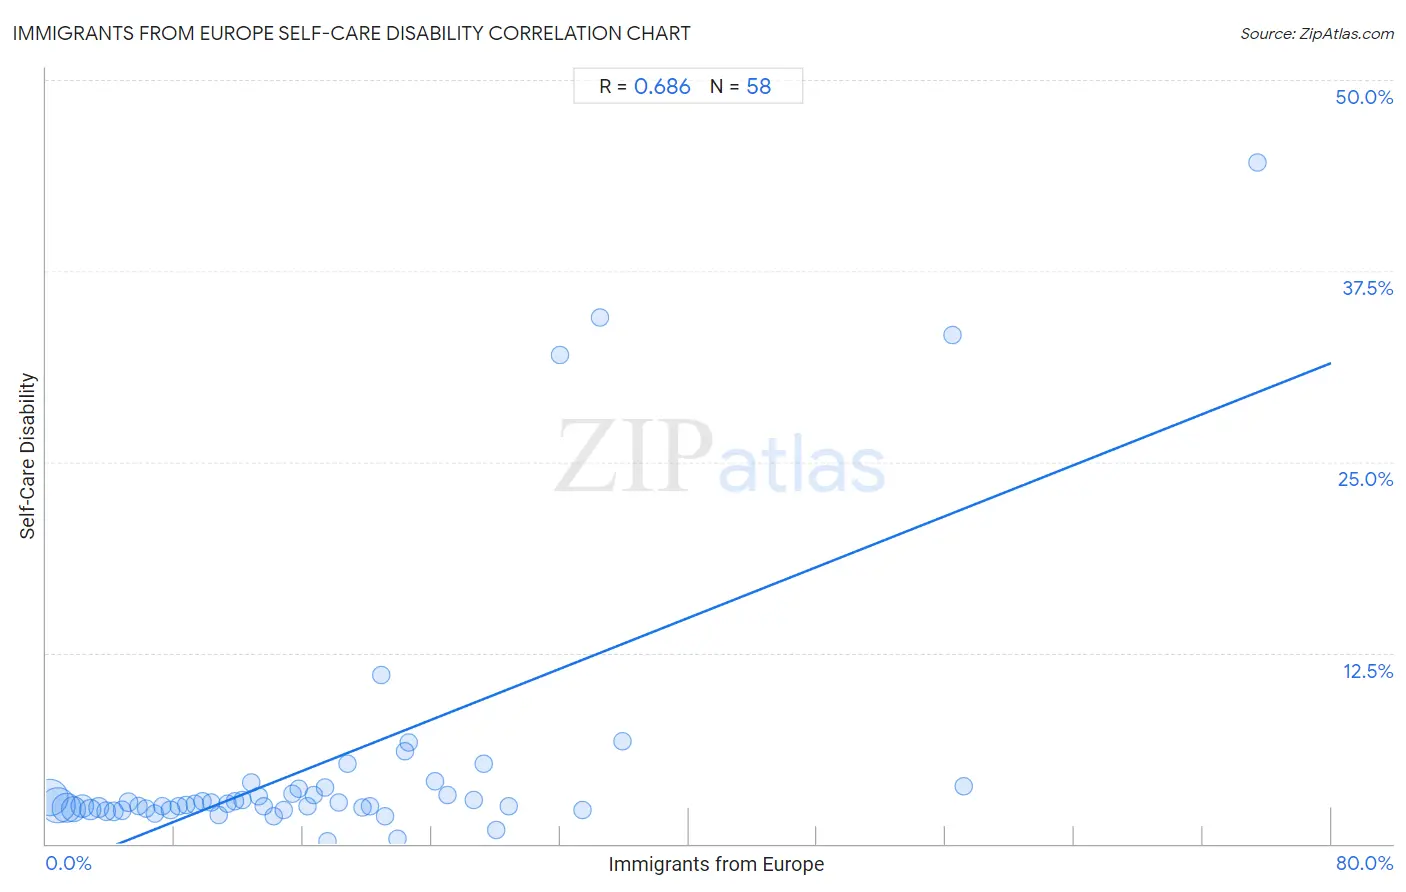
Immigrants from Europe Self-Care Disability Correlation Chart
The statistical analysis conducted on geographies consisting of 545,734,078 people shows a significant positive correlation between the proportion of Immigrants from Europe and percentage of population with self-care disability in the United States with a correlation coefficient (R) of 0.686 and weighted average of 2.4%. On average, for every 1% (one percent) increase in Immigrants from Europe within a typical geography, there is an increase of 0.42% in percentage of population with self-care disability.
It is essential to understand that the correlation between the percentage of Immigrants from Europe and percentage of population with self-care disability does not imply a direct cause-and-effect relationship. It remains uncertain whether the presence of Immigrants from Europe influences an upward or downward trend in the level of percentage of population with self-care disability within an area, or if Immigrants from Europe simply ended up residing in those areas with higher or lower levels of percentage of population with self-care disability due to other factors.
Demographics Similar to Immigrants from Europe by Self-Care Disability
In terms of self-care disability, the demographic groups most similar to Immigrants from Europe are Nigerian (2.4%, a difference of 0.060%), Immigrants from Western Europe (2.4%, a difference of 0.060%), Immigrants from Italy (2.4%, a difference of 0.060%), Pakistani (2.4%, a difference of 0.11%), and Finnish (2.4%, a difference of 0.14%).
| Demographics | Rating | Rank | Self-Care Disability |
| Immigrants from Costa Rica | 75.1 /100 | #150 | Good 2.4% |
| Basques | 74.0 /100 | #151 | Good 2.4% |
| Tlingit-Haida | 73.5 /100 | #152 | Good 2.4% |
| Immigrants from England | 73.5 /100 | #153 | Good 2.4% |
| Italians | 72.2 /100 | #154 | Good 2.4% |
| Pakistanis | 71.4 /100 | #155 | Good 2.4% |
| Nigerians | 70.6 /100 | #156 | Good 2.4% |
| Immigrants from Europe | 69.6 /100 | #157 | Good 2.4% |
| Immigrants from Western Europe | 68.6 /100 | #158 | Good 2.4% |
| Immigrants from Italy | 68.5 /100 | #159 | Good 2.4% |
| Finns | 67.0 /100 | #160 | Good 2.4% |
| Lebanese | 66.5 /100 | #161 | Good 2.4% |
| Somalis | 63.7 /100 | #162 | Good 2.5% |
| German Russians | 62.7 /100 | #163 | Good 2.5% |
| Immigrants from Vietnam | 59.3 /100 | #164 | Average 2.5% |
Immigrants from Europe Self-Care Disability Correlation Summary
| Measurement | Immigrants from Europe Data | Self-Care Disability Data |
| Minimum | 0.26% | 0.20% |
| Maximum | 75.4% | 44.6% |
| Range | 75.2% | 44.4% |
| Mean | 17.1% | 5.3% |
| Median | 14.5% | 2.6% |
| Interquartile 25% (IQ1) | 7.2% | 2.3% |
| Interquartile 75% (IQ3) | 22.3% | 3.6% |
| Interquartile Range (IQR) | 15.1% | 1.3% |
| Standard Deviation (Sample) | 14.3% | 8.7% |
| Standard Deviation (Population) | 14.2% | 8.6% |
Correlation Details
| Immigrants from Europe Percentile | Sample Size | Self-Care Disability |
[ 0.0% - 0.5% ] 0.26% | 142,761,712 | 3.0% |
[ 0.5% - 1.0% ] 0.72% | 129,655,695 | 2.5% |
[ 1.0% - 1.5% ] 1.24% | 81,226,544 | 2.3% |
[ 1.5% - 2.0% ] 1.72% | 50,881,136 | 2.3% |
[ 2.0% - 2.5% ] 2.25% | 40,357,359 | 2.4% |
[ 2.5% - 3.0% ] 2.74% | 23,798,859 | 2.2% |
[ 3.0% - 3.5% ] 3.25% | 18,841,741 | 2.4% |
[ 3.5% - 4.0% ] 3.73% | 10,672,409 | 2.1% |
[ 4.0% - 4.5% ] 4.24% | 8,510,742 | 2.1% |
[ 4.5% - 5.0% ] 4.73% | 5,679,134 | 2.2% |
[ 5.0% - 5.5% ] 5.13% | 14,301,564 | 2.7% |
[ 5.5% - 6.0% ] 5.74% | 4,152,781 | 2.5% |
[ 6.0% - 6.5% ] 6.24% | 2,746,578 | 2.3% |
[ 6.5% - 7.0% ] 6.76% | 2,521,633 | 2.0% |
[ 7.0% - 7.5% ] 7.24% | 1,465,930 | 2.5% |
[ 7.5% - 8.0% ] 7.74% | 1,265,856 | 2.2% |
[ 8.0% - 8.5% ] 8.27% | 944,014 | 2.5% |
[ 8.5% - 9.0% ] 8.72% | 830,266 | 2.5% |
[ 9.0% - 9.5% ] 9.26% | 799,723 | 2.6% |
[ 9.5% - 10.0% ] 9.75% | 484,595 | 2.8% |
[ 10.0% - 10.5% ] 10.28% | 640,381 | 2.7% |
[ 10.5% - 11.0% ] 10.76% | 107,934 | 1.9% |
[ 11.0% - 11.5% ] 11.30% | 309,205 | 2.6% |
[ 11.5% - 12.0% ] 11.77% | 492,223 | 2.8% |
[ 12.0% - 12.5% ] 12.21% | 404,598 | 2.8% |
[ 12.5% - 13.0% ] 12.73% | 180,487 | 4.0% |
[ 13.0% - 13.5% ] 13.21% | 288,595 | 3.1% |
[ 13.5% - 14.0% ] 13.55% | 123,908 | 2.4% |
[ 14.0% - 14.5% ] 14.19% | 234,273 | 1.8% |
[ 14.5% - 15.0% ] 14.80% | 140,286 | 2.2% |
[ 15.0% - 15.5% ] 15.30% | 237,814 | 3.3% |
[ 15.5% - 16.0% ] 15.71% | 39,214 | 3.6% |
[ 16.0% - 16.5% ] 16.24% | 56,142 | 2.4% |
[ 16.5% - 17.0% ] 16.68% | 121,306 | 3.2% |
[ 17.0% - 17.5% ] 17.35% | 82,211 | 3.7% |
[ 17.5% - 18.0% ] 17.51% | 1,885 | 0.20% |
[ 18.0% - 18.5% ] 18.25% | 36,720 | 2.7% |
[ 18.5% - 19.0% ] 18.76% | 3,214 | 5.3% |
[ 19.5% - 20.0% ] 19.66% | 2,401 | 2.4% |
[ 20.0% - 20.5% ] 20.18% | 65,907 | 2.5% |
[ 20.5% - 21.0% ] 20.87% | 436 | 11.0% |
[ 21.0% - 21.5% ] 21.06% | 30,524 | 1.8% |
[ 21.5% - 22.0% ] 21.83% | 1,864 | 0.35% |
[ 22.0% - 22.5% ] 22.30% | 2,049 | 6.1% |
[ 22.5% - 23.0% ] 22.53% | 648 | 6.6% |
[ 24.0% - 24.5% ] 24.23% | 194 | 4.1% |
[ 25.0% - 25.5% ] 25.00% | 300 | 3.2% |
[ 26.5% - 27.0% ] 26.65% | 17,166 | 2.8% |
[ 27.0% - 27.5% ] 27.26% | 72,126 | 5.2% |
[ 28.0% - 28.5% ] 28.03% | 23,200 | 0.86% |
[ 28.5% - 29.0% ] 28.80% | 8,942 | 2.4% |
[ 32.0% - 32.5% ] 32.00% | 25 | 32.0% |
[ 33.0% - 33.5% ] 33.42% | 25,808 | 2.2% |
[ 34.0% - 34.5% ] 34.48% | 58 | 34.5% |
[ 35.5% - 36.0% ] 35.90% | 83,069 | 6.7% |
[ 56.0% - 56.5% ] 56.39% | 321 | 33.3% |
[ 57.0% - 57.5% ] 57.14% | 133 | 3.8% |
[ 75.0% - 75.5% ] 75.42% | 240 | 44.6% |