Immigrants from Europe Married-couple Households
COMPARE
Immigrants from Europe
Select to Compare
Married-couple Households
Immigrants from Europe Married-couple Households
47.6%
MARRIED-COUPLE HOUSEHOLDS
93.7/ 100
METRIC RATING
114th/ 347
METRIC RANK
Immigrants from Europe Married-couple Households Correlation Chart
The statistical analysis conducted on geographies consisting of 546,870,459 people shows a substantial positive correlation between the proportion of Immigrants from Europe and percentage of married-couple family households in the United States with a correlation coefficient (R) of 0.585 and weighted average of 47.6%. On average, for every 1% (one percent) increase in Immigrants from Europe within a typical geography, there is an increase of 0.54% in percentage of married-couple family households.
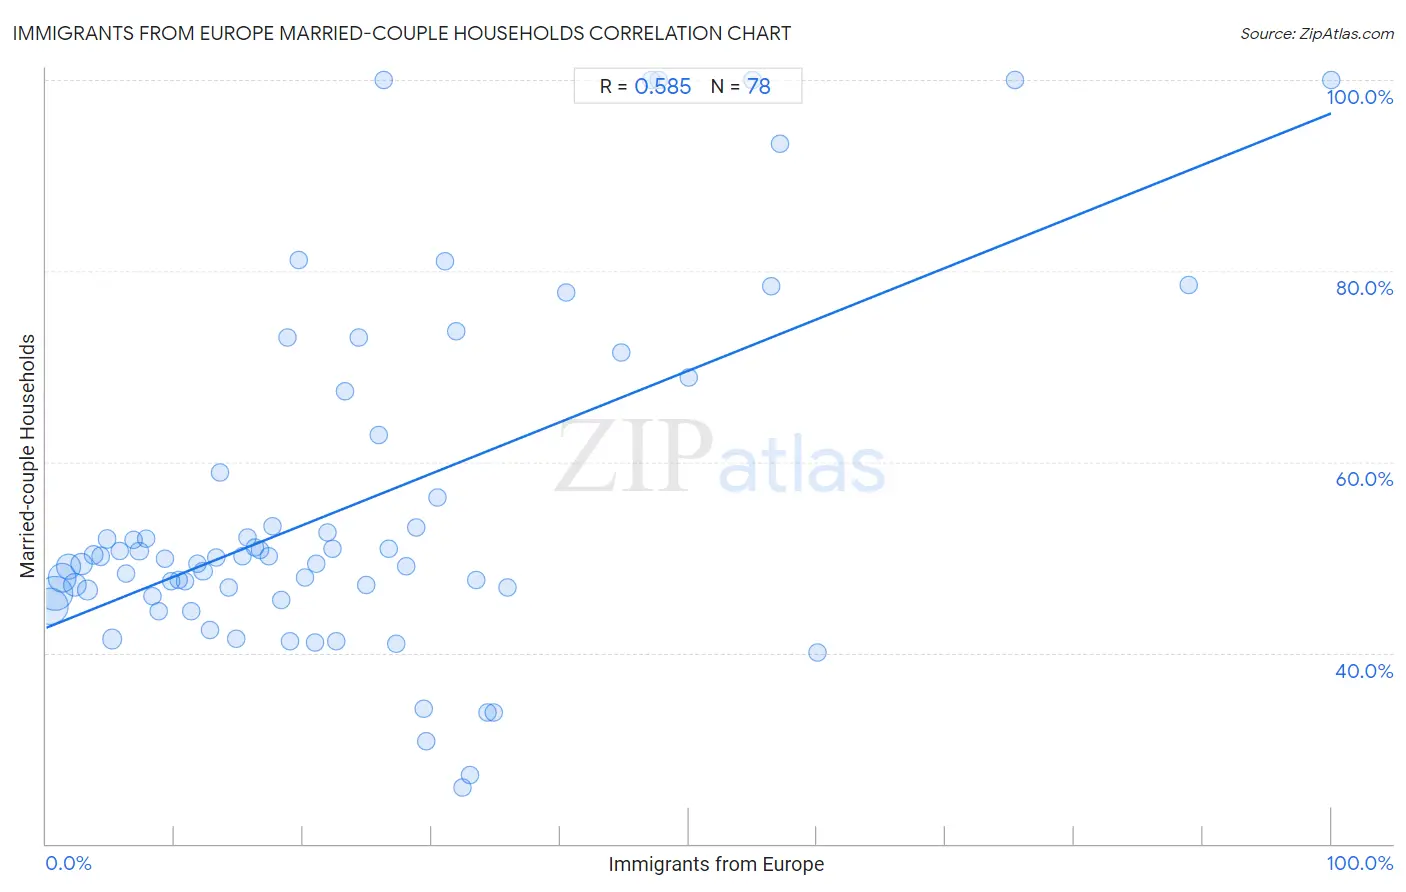
It is essential to understand that the correlation between the percentage of Immigrants from Europe and percentage of married-couple family households does not imply a direct cause-and-effect relationship. It remains uncertain whether the presence of Immigrants from Europe influences an upward or downward trend in the level of percentage of married-couple family households within an area, or if Immigrants from Europe simply ended up residing in those areas with higher or lower levels of percentage of married-couple family households due to other factors.
Demographics Similar to Immigrants from Europe by Married-couple Households
In terms of married-couple households, the demographic groups most similar to Immigrants from Europe are Venezuelan (47.6%, a difference of 0.010%), Peruvian (47.6%, a difference of 0.020%), Macedonian (47.6%, a difference of 0.030%), Syrian (47.6%, a difference of 0.030%), and Immigrants from Jordan (47.7%, a difference of 0.060%).
| Demographics | Rating | Rank | Married-couple Households |
| Estonians | 94.7 /100 | #107 | Exceptional 47.7% |
| Immigrants from Japan | 94.4 /100 | #108 | Exceptional 47.7% |
| Immigrants from Jordan | 94.1 /100 | #109 | Exceptional 47.7% |
| Macedonians | 93.9 /100 | #110 | Exceptional 47.6% |
| Syrians | 93.9 /100 | #111 | Exceptional 47.6% |
| Peruvians | 93.8 /100 | #112 | Exceptional 47.6% |
| Venezuelans | 93.8 /100 | #113 | Exceptional 47.6% |
| Immigrants from Europe | 93.7 /100 | #114 | Exceptional 47.6% |
| Slovaks | 92.9 /100 | #115 | Exceptional 47.6% |
| Argentineans | 92.5 /100 | #116 | Exceptional 47.5% |
| French Canadians | 92.4 /100 | #117 | Exceptional 47.5% |
| Immigrants from Germany | 92.4 /100 | #118 | Exceptional 47.5% |
| Chileans | 92.2 /100 | #119 | Exceptional 47.5% |
| Puget Sound Salish | 90.5 /100 | #120 | Exceptional 47.4% |
| Immigrants from Eastern Europe | 90.3 /100 | #121 | Exceptional 47.4% |
Immigrants from Europe Married-couple Households Correlation Summary
| Measurement | Immigrants from Europe Data | Married-couple Households Data |
| Minimum | 0.26% | 25.9% |
| Maximum | 100.0% | 100.0% |
| Range | 99.7% | 74.1% |
| Mean | 23.6% | 55.4% |
| Median | 19.3% | 49.9% |
| Interquartile 25% (IQ1) | 9.8% | 46.2% |
| Interquartile 75% (IQ3) | 31.1% | 58.8% |
| Interquartile Range (IQR) | 21.3% | 12.6% |
| Standard Deviation (Sample) | 19.6% | 18.1% |
| Standard Deviation (Population) | 19.5% | 18.0% |
Correlation Details
| Immigrants from Europe Percentile | Sample Size | Married-couple Households |
[ 0.0% - 0.5% ] 0.26% | 142,963,956 | 44.9% |
[ 0.5% - 1.0% ] 0.72% | 129,862,921 | 46.2% |
[ 1.0% - 1.5% ] 1.24% | 81,376,721 | 47.8% |
[ 1.5% - 2.0% ] 1.72% | 51,009,100 | 49.0% |
[ 2.0% - 2.5% ] 2.25% | 40,424,779 | 47.1% |
[ 2.5% - 3.0% ] 2.74% | 23,851,879 | 49.3% |
[ 3.0% - 3.5% ] 3.25% | 18,886,083 | 46.6% |
[ 3.5% - 4.0% ] 3.73% | 10,719,060 | 50.2% |
[ 4.0% - 4.5% ] 4.24% | 8,542,182 | 50.1% |
[ 4.5% - 5.0% ] 4.73% | 5,705,815 | 51.9% |
[ 5.0% - 5.5% ] 5.13% | 14,321,435 | 41.4% |
[ 5.5% - 6.0% ] 5.74% | 4,169,943 | 50.6% |
[ 6.0% - 6.5% ] 6.24% | 2,766,550 | 48.3% |
[ 6.5% - 7.0% ] 6.76% | 2,542,207 | 51.8% |
[ 7.0% - 7.5% ] 7.23% | 1,481,144 | 50.7% |
[ 7.5% - 8.0% ] 7.74% | 1,272,401 | 51.9% |
[ 8.0% - 8.5% ] 8.27% | 958,606 | 45.9% |
[ 8.5% - 9.0% ] 8.71% | 840,020 | 44.4% |
[ 9.0% - 9.5% ] 9.26% | 808,269 | 49.9% |
[ 9.5% - 10.0% ] 9.75% | 493,983 | 47.5% |
[ 10.0% - 10.5% ] 10.28% | 643,437 | 47.6% |
[ 10.5% - 11.0% ] 10.76% | 112,219 | 47.5% |
[ 11.0% - 11.5% ] 11.30% | 312,655 | 44.4% |
[ 11.5% - 12.0% ] 11.77% | 493,330 | 49.3% |
[ 12.0% - 12.5% ] 12.21% | 409,157 | 48.6% |
[ 12.5% - 13.0% ] 12.73% | 181,419 | 42.4% |
[ 13.0% - 13.5% ] 13.21% | 289,387 | 49.9% |
[ 13.5% - 14.0% ] 13.55% | 125,399 | 58.8% |
[ 14.0% - 14.5% ] 14.19% | 237,268 | 46.8% |
[ 14.5% - 15.0% ] 14.80% | 140,327 | 41.5% |
[ 15.0% - 15.5% ] 15.30% | 239,636 | 50.1% |
[ 15.5% - 16.0% ] 15.71% | 39,842 | 52.1% |
[ 16.0% - 16.5% ] 16.25% | 58,439 | 51.1% |
[ 16.5% - 17.0% ] 16.68% | 122,288 | 50.8% |
[ 17.0% - 17.5% ] 17.35% | 83,241 | 50.1% |
[ 17.5% - 18.0% ] 17.64% | 2,869 | 53.3% |
[ 18.0% - 18.5% ] 18.24% | 37,688 | 45.6% |
[ 18.5% - 19.0% ] 18.77% | 3,868 | 73.0% |
[ 19.0% - 19.5% ] 19.01% | 142 | 41.3% |
[ 19.5% - 20.0% ] 19.66% | 2,431 | 81.1% |
[ 20.0% - 20.5% ] 20.18% | 65,907 | 47.9% |
[ 20.5% - 21.0% ] 20.89% | 675 | 41.1% |
[ 21.0% - 21.5% ] 21.06% | 30,714 | 49.4% |
[ 21.5% - 22.0% ] 21.84% | 2,289 | 52.7% |
[ 22.0% - 22.5% ] 22.30% | 2,049 | 50.9% |
[ 22.5% - 23.0% ] 22.53% | 648 | 41.2% |
[ 23.0% - 23.5% ] 23.28% | 799 | 67.4% |
[ 24.0% - 24.5% ] 24.31% | 469 | 73.0% |
[ 24.5% - 25.0% ] 24.95% | 473 | 47.1% |
[ 25.5% - 26.0% ] 25.83% | 391 | 62.9% |
[ 26.0% - 26.5% ] 26.24% | 202 | 100.0% |
[ 26.5% - 27.0% ] 26.65% | 17,166 | 50.9% |
[ 27.0% - 27.5% ] 27.26% | 72,291 | 40.9% |
[ 28.0% - 28.5% ] 28.03% | 23,288 | 49.0% |
[ 28.5% - 29.0% ] 28.80% | 8,963 | 53.1% |
[ 29.0% - 29.5% ] 29.41% | 238 | 34.1% |
[ 29.5% - 30.0% ] 29.60% | 402 | 30.7% |
[ 30.0% - 30.5% ] 30.43% | 46 | 56.2% |
[ 31.0% - 31.5% ] 31.06% | 483 | 81.0% |
[ 31.5% - 32.0% ] 31.88% | 69 | 73.7% |
[ 32.0% - 32.5% ] 32.43% | 37 | 25.9% |
[ 32.5% - 33.0% ] 32.95% | 88 | 27.1% |
[ 33.0% - 33.5% ] 33.42% | 25,808 | 47.7% |
[ 34.0% - 34.5% ] 34.34% | 332 | 33.7% |
[ 34.5% - 35.0% ] 34.81% | 181 | 33.7% |
[ 35.5% - 36.0% ] 35.90% | 83,069 | 46.8% |
[ 40.5% - 41.0% ] 40.51% | 274 | 77.7% |
[ 44.5% - 45.0% ] 44.74% | 38 | 71.4% |
[ 47.0% - 47.5% ] 47.06% | 68 | 100.0% |
[ 47.5% - 48.0% ] 47.69% | 65 | 100.0% |
[ 50.0% - 50.5% ] 50.00% | 54 | 68.9% |
[ 55.0% - 55.5% ] 55.00% | 20 | 100.0% |
[ 56.0% - 56.5% ] 56.39% | 321 | 78.4% |
[ 57.0% - 57.5% ] 57.14% | 133 | 93.3% |
[ 60.0% - 60.5% ] 60.00% | 25 | 40.0% |
[ 75.0% - 75.5% ] 75.42% | 240 | 100.0% |
[ 88.5% - 89.0% ] 88.89% | 27 | 78.6% |
[ 99.5% - 100.0% ] 100.00% | 21 | 100.0% |