Immigrants from Europe 3 or more Vehicles in Household
COMPARE
Immigrants from Europe
Select to Compare
3 or more Vehicles in Household
Immigrants from Europe 3 or more Vehicles in Household
18.1%
3+ VEHICLES AVAILABLE
2.4/ 100
METRIC RATING
243rd/ 347
METRIC RANK
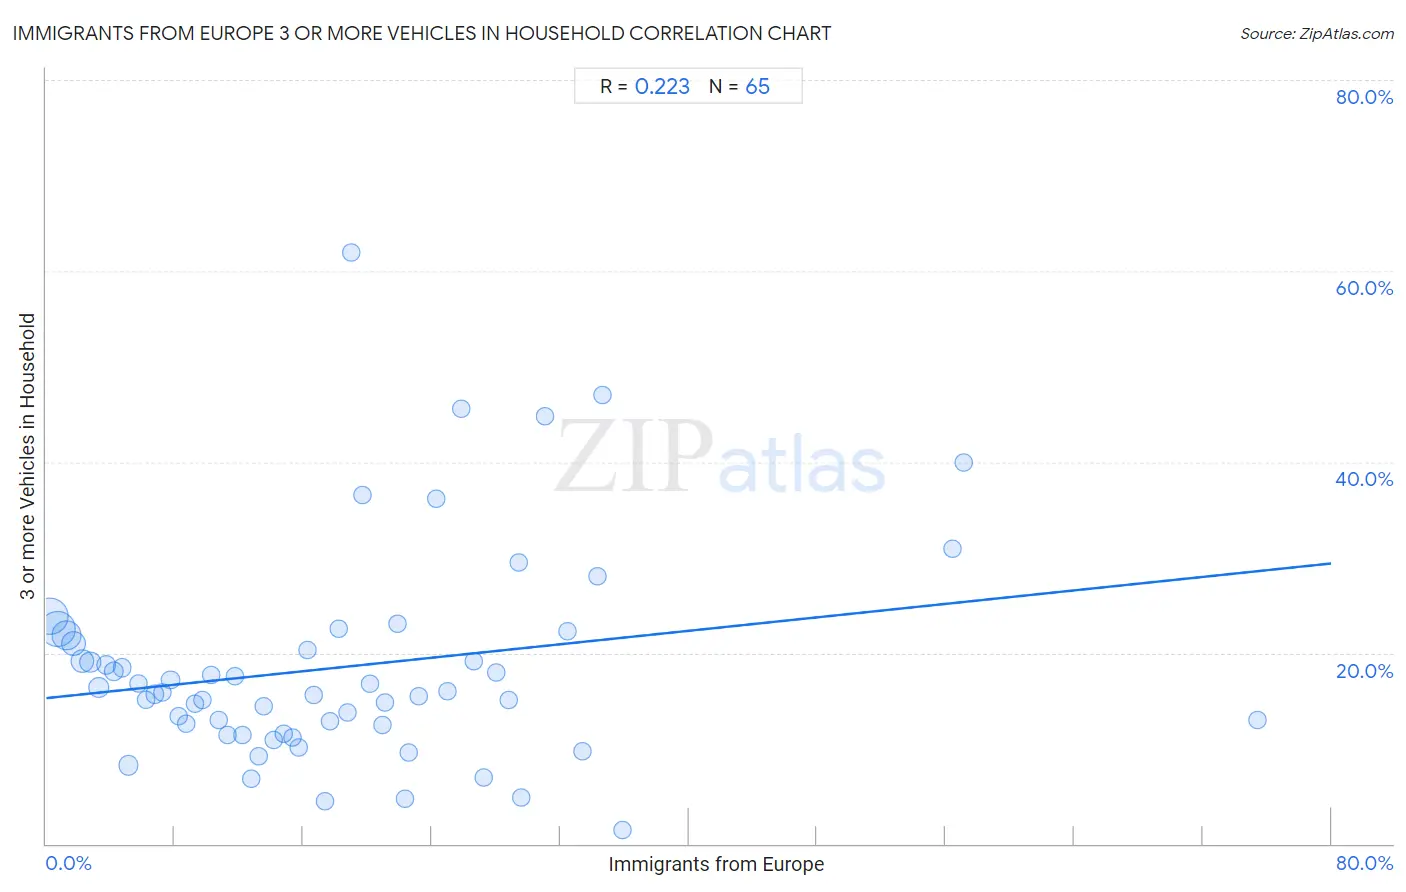
Immigrants from Europe 3 or more Vehicles in Household Correlation Chart
The statistical analysis conducted on geographies consisting of 546,637,785 people shows a weak positive correlation between the proportion of Immigrants from Europe and percentage of households with 3 or more vehicles available in the United States with a correlation coefficient (R) of 0.223 and weighted average of 18.1%. On average, for every 1% (one percent) increase in Immigrants from Europe within a typical geography, there is an increase of 0.18% in percentage of households with 3 or more vehicles available.
It is essential to understand that the correlation between the percentage of Immigrants from Europe and percentage of households with 3 or more vehicles available does not imply a direct cause-and-effect relationship. It remains uncertain whether the presence of Immigrants from Europe influences an upward or downward trend in the level of percentage of households with 3 or more vehicles available within an area, or if Immigrants from Europe simply ended up residing in those areas with higher or lower levels of percentage of households with 3 or more vehicles available due to other factors.
Demographics Similar to Immigrants from Europe by 3 or more Vehicles in Household
In terms of 3 or more vehicles in household, the demographic groups most similar to Immigrants from Europe are Hopi (18.2%, a difference of 0.12%), Mongolian (18.1%, a difference of 0.12%), African (18.2%, a difference of 0.23%), Immigrants from Belize (18.1%, a difference of 0.28%), and Immigrants from Australia (18.1%, a difference of 0.35%).
| Demographics | Rating | Rank | 3 or more Vehicles in Household |
| Immigrants from Malaysia | 3.6 /100 | #236 | Tragic 18.3% |
| Indonesians | 3.5 /100 | #237 | Tragic 18.3% |
| Immigrants from Honduras | 3.1 /100 | #238 | Tragic 18.2% |
| Immigrants from Middle Africa | 3.1 /100 | #239 | Tragic 18.2% |
| Immigrants from China | 2.9 /100 | #240 | Tragic 18.2% |
| Africans | 2.7 /100 | #241 | Tragic 18.2% |
| Hopi | 2.5 /100 | #242 | Tragic 18.2% |
| Immigrants from Europe | 2.4 /100 | #243 | Tragic 18.1% |
| Mongolians | 2.3 /100 | #244 | Tragic 18.1% |
| Immigrants from Belize | 2.1 /100 | #245 | Tragic 18.1% |
| Immigrants from Australia | 2.0 /100 | #246 | Tragic 18.1% |
| Carpatho Rusyns | 1.9 /100 | #247 | Tragic 18.0% |
| Immigrants from Eastern Africa | 1.8 /100 | #248 | Tragic 18.0% |
| Immigrants from Saudi Arabia | 1.7 /100 | #249 | Tragic 18.0% |
| Venezuelans | 1.7 /100 | #250 | Tragic 18.0% |
Immigrants from Europe 3 or more Vehicles in Household Correlation Summary
| Measurement | Immigrants from Europe Data | 3 or more Vehicles in Household Data |
| Minimum | 0.26% | 1.4% |
| Maximum | 75.4% | 61.9% |
| Range | 75.2% | 60.5% |
| Mean | 18.3% | 18.5% |
| Median | 16.3% | 15.9% |
| Interquartile 25% (IQ1) | 8.0% | 11.9% |
| Interquartile 75% (IQ3) | 25.4% | 21.4% |
| Interquartile Range (IQR) | 17.4% | 9.5% |
| Standard Deviation (Sample) | 14.0% | 11.1% |
| Standard Deviation (Population) | 13.9% | 11.0% |
Correlation Details
| Immigrants from Europe Percentile | Sample Size | 3 or more Vehicles in Household |
[ 0.0% - 0.5% ] 0.26% | 142,924,712 | 23.8% |
[ 0.5% - 1.0% ] 0.72% | 129,834,419 | 22.5% |
[ 1.0% - 1.5% ] 1.24% | 81,379,365 | 21.8% |
[ 1.5% - 2.0% ] 1.72% | 51,002,233 | 20.9% |
[ 2.0% - 2.5% ] 2.25% | 40,400,319 | 19.1% |
[ 2.5% - 3.0% ] 2.74% | 23,844,213 | 19.0% |
[ 3.0% - 3.5% ] 3.25% | 18,872,897 | 16.4% |
[ 3.5% - 4.0% ] 3.73% | 10,711,197 | 18.7% |
[ 4.0% - 4.5% ] 4.24% | 8,526,762 | 18.1% |
[ 4.5% - 5.0% ] 4.73% | 5,701,410 | 18.4% |
[ 5.0% - 5.5% ] 5.13% | 14,318,602 | 8.2% |
[ 5.5% - 6.0% ] 5.74% | 4,167,858 | 16.8% |
[ 6.0% - 6.5% ] 6.24% | 2,738,713 | 15.1% |
[ 6.5% - 7.0% ] 6.76% | 2,541,508 | 15.7% |
[ 7.0% - 7.5% ] 7.24% | 1,477,616 | 15.9% |
[ 7.5% - 8.0% ] 7.74% | 1,272,401 | 17.2% |
[ 8.0% - 8.5% ] 8.27% | 931,264 | 13.4% |
[ 8.5% - 9.0% ] 8.71% | 839,872 | 12.5% |
[ 9.0% - 9.5% ] 9.26% | 805,969 | 14.7% |
[ 9.5% - 10.0% ] 9.75% | 482,967 | 15.0% |
[ 10.0% - 10.5% ] 10.28% | 643,437 | 17.7% |
[ 10.5% - 11.0% ] 10.76% | 112,297 | 12.9% |
[ 11.0% - 11.5% ] 11.30% | 312,423 | 11.4% |
[ 11.5% - 12.0% ] 11.77% | 492,667 | 17.5% |
[ 12.0% - 12.5% ] 12.21% | 407,372 | 11.4% |
[ 12.5% - 13.0% ] 12.73% | 181,419 | 6.9% |
[ 13.0% - 13.5% ] 13.21% | 289,387 | 9.2% |
[ 13.5% - 14.0% ] 13.55% | 125,011 | 14.5% |
[ 14.0% - 14.5% ] 14.19% | 237,054 | 10.9% |
[ 14.5% - 15.0% ] 14.80% | 140,327 | 11.5% |
[ 15.0% - 15.5% ] 15.30% | 237,814 | 11.2% |
[ 15.5% - 16.0% ] 15.71% | 39,842 | 10.0% |
[ 16.0% - 16.5% ] 16.25% | 56,556 | 20.3% |
[ 16.5% - 17.0% ] 16.68% | 121,916 | 15.5% |
[ 17.0% - 17.5% ] 17.35% | 83,241 | 4.4% |
[ 17.5% - 18.0% ] 17.64% | 2,869 | 12.9% |
[ 18.0% - 18.5% ] 18.25% | 37,122 | 22.5% |
[ 18.5% - 19.0% ] 18.77% | 3,911 | 13.8% |
[ 19.0% - 19.5% ] 19.01% | 142 | 61.9% |
[ 19.5% - 20.0% ] 19.66% | 2,401 | 36.5% |
[ 20.0% - 20.5% ] 20.18% | 65,907 | 16.7% |
[ 20.5% - 21.0% ] 20.91% | 397 | 12.4% |
[ 21.0% - 21.5% ] 21.06% | 30,714 | 14.7% |
[ 21.5% - 22.0% ] 21.84% | 2,289 | 23.0% |
[ 22.0% - 22.5% ] 22.30% | 2,049 | 4.7% |
[ 22.5% - 23.0% ] 22.53% | 648 | 9.5% |
[ 23.0% - 23.5% ] 23.22% | 577 | 15.5% |
[ 24.0% - 24.5% ] 24.31% | 469 | 36.2% |
[ 25.0% - 25.5% ] 25.00% | 316 | 16.0% |
[ 25.5% - 26.0% ] 25.83% | 391 | 45.6% |
[ 26.5% - 27.0% ] 26.65% | 17,166 | 19.1% |
[ 27.0% - 27.5% ] 27.26% | 72,126 | 7.0% |
[ 28.0% - 28.5% ] 28.03% | 23,200 | 18.0% |
[ 28.5% - 29.0% ] 28.80% | 8,942 | 15.0% |
[ 29.0% - 29.5% ] 29.41% | 238 | 29.4% |
[ 29.5% - 30.0% ] 29.60% | 402 | 4.9% |
[ 31.0% - 31.5% ] 31.06% | 483 | 44.8% |
[ 32.0% - 32.5% ] 32.43% | 37 | 22.2% |
[ 33.0% - 33.5% ] 33.42% | 25,808 | 9.7% |
[ 34.0% - 34.5% ] 34.34% | 332 | 28.0% |
[ 34.5% - 35.0% ] 34.62% | 26 | 47.1% |
[ 35.5% - 36.0% ] 35.90% | 83,069 | 1.4% |
[ 56.0% - 56.5% ] 56.39% | 321 | 30.9% |
[ 57.0% - 57.5% ] 57.14% | 133 | 40.0% |
[ 75.0% - 75.5% ] 75.42% | 240 | 13.0% |