Immigrants from Europe Wage/Income Gap

COMPARE

Immigrants from Europe
Race
Ancestry
AfghanAfricanAlaska NativeAlaskan AthabascanAlbanianAleutAlsatianAmericanApacheArabArapahoArgentineanArmenianAssyrian/Chaldean/SyriacAustralianAustrianBahamianBangladeshiBarbadianBasqueBelgianBelizeanBermudanBhutaneseBlackfeetBolivianBrazilianBritishBritish West IndianBulgarianBurmeseCajunCambodianCanadianCape VerdeanCarpatho RusynCelticCentral AmericanCentral American IndianCherokeeCheyenneChickasawChileanChineseChippewaChoctawColombianColvilleComancheCosta RicanCreeCreekCroatianCrowCubanCypriotCzechCzechoslovakianDanishDelawareDominicanDutchDutch West IndianEastern EuropeanEcuadorianEgyptianEnglishEstonianEthiopianEuropeanFijianFilipinoFinnishFrenchFrench American IndianFrench CanadianGermanGerman RussianGhanaianGreekGuamanian/ChamorroGuatemalanGuyaneseHaitianHmongHonduranHopiHoumaHungarianIcelanderIndian (Asian)IndonesianInupiatIranianIraqiIrishIroquoisIsraeliItalianJamaicanJapaneseJordanianKenyanKiowaKoreanLaotianLatvianLebaneseLiberianLithuanianLumbeeLuxembourgerMacedonianMalaysianMalteseMarshalleseMenomineeMexicanMexican American IndianMongolianMoroccanNative HawaiianNavajoNepaleseNew ZealanderNicaraguanNigerianNorthern EuropeanNorwegianOkinawanOsageOttawaPaiutePakistaniPalestinianPanamanianParaguayanPennsylvania GermanPeruvianPimaPolishPortuguesePotawatomiPuebloPuerto RicanPuget Sound SalishRomanianRussianSalvadoranSamoanScandinavianScotch-IrishScottishSeminoleSenegaleseSerbianShoshoneSierra LeoneanSiouxSlavicSlovakSloveneSomaliSouth AfricanSouth AmericanSouth American IndianSoviet UnionSpaniardSpanishSpanish AmericanSpanish American IndianSri LankanSubsaharan AfricanSudaneseSwedishSwissSyrianTaiwaneseThaiTlingit-HaidaTohono O'OdhamTonganTrinidadian and TobagonianTsimshianTurkishU.S. Virgin IslanderUgandanUkrainianUruguayanUteVenezuelanVietnameseWelshWest IndianYakamaYaquiYugoslavianYumanYup'ikZimbabwean
Immigration
NonimmigrantsImmigrantsAfghanistanAfricaAlbaniaArgentinaArmeniaAsiaAustraliaAustriaBahamasBangladeshBarbadosBelarusBelgiumBelizeBoliviaBosnia and HerzegovinaBrazilBulgariaBurma/MyanmarCabo VerdeCambodiaCameroonCanadaCaribbeanCentral AmericaChileChinaColombiaCongoCosta RicaCroatiaCubaCzechoslovakiaDenmarkDominicaDominican RepublicEastern AfricaEastern AsiaEastern EuropeEcuadorEgyptEl SalvadorEnglandEritreaEthiopiaEuropeFijiFranceGermanyGhanaGreeceGrenadaGuatemalaGuyanaHaitiHondurasHong KongHungaryIndiaIndonesiaIranIraqIrelandIsraelItalyJamaicaJapanJordanKazakhstanKenyaKoreaKuwaitLaosLatin AmericaLatviaLebanonLiberiaLithuaniaMalaysiaMexicoMicronesiaMiddle AfricaMoldovaMoroccoNepalNetherlandsNicaraguaNigeriaNorth AmericaNorth MacedoniaNorthern AfricaNorthern EuropeNorwayOceaniaPakistanPanamaPeruPhilippinesPolandPortugalRomaniaRussiaSaudi ArabiaScotlandSenegalSerbiaSierra LeoneSingaporeSomaliaSouth AfricaSouth AmericaSouth Central AsiaSouth Eastern AsiaSouthern EuropeSpainSri LankaSt. Vincent and the GrenadinesSudanSwedenSwitzerlandSyriaTaiwanThailandTrinidad and TobagoTurkeyUgandaUkraineUruguayUzbekistanVenezuelaVietnamWest IndiesWestern AfricaWestern AsiaWestern EuropeYemenZaireZimbabweAzores
Select to Compare
Race
Ancestry
AfghanAfricanAlaska NativeAlaskan AthabascanAlbanianAleutAlsatianAmericanApacheArabArapahoArgentineanArmenianAssyrian/Chaldean/SyriacAustralianAustrianBahamianBangladeshiBarbadianBasqueBelgianBelizeanBermudanBhutaneseBlackfeetBolivianBrazilianBritishBritish West IndianBulgarianBurmeseCajunCambodianCanadianCape VerdeanCarpatho RusynCelticCentral AmericanCentral American IndianCherokeeCheyenneChickasawChileanChineseChippewaChoctawColombianColvilleComancheCosta RicanCreeCreekCroatianCrowCubanCypriotCzechCzechoslovakianDanishDelawareDominicanDutchDutch West IndianEastern EuropeanEcuadorianEgyptianEnglishEstonianEthiopianEuropeanFijianFilipinoFinnishFrenchFrench American IndianFrench CanadianGermanGerman RussianGhanaianGreekGuamanian/ChamorroGuatemalanGuyaneseHaitianHmongHonduranHopiHoumaHungarianIcelanderIndian (Asian)IndonesianInupiatIranianIraqiIrishIroquoisIsraeliItalianJamaicanJapaneseJordanianKenyanKiowaKoreanLaotianLatvianLebaneseLiberianLithuanianLumbeeLuxembourgerMacedonianMalaysianMalteseMarshalleseMenomineeMexicanMexican American IndianMongolianMoroccanNative HawaiianNavajoNepaleseNew ZealanderNicaraguanNigerianNorthern EuropeanNorwegianOkinawanOsageOttawaPaiutePakistaniPalestinianPanamanianParaguayanPennsylvania GermanPeruvianPimaPolishPortuguesePotawatomiPuebloPuerto RicanPuget Sound SalishRomanianRussianSalvadoranSamoanScandinavianScotch-IrishScottishSeminoleSenegaleseSerbianShoshoneSierra LeoneanSiouxSlavicSlovakSloveneSomaliSouth AfricanSouth AmericanSouth American IndianSoviet UnionSpaniardSpanishSpanish AmericanSpanish American IndianSri LankanSubsaharan AfricanSudaneseSwedishSwissSyrianTaiwaneseThaiTlingit-HaidaTohono O'OdhamTonganTrinidadian and TobagonianTsimshianTurkishU.S. Virgin IslanderUgandanUkrainianUruguayanUteVenezuelanVietnameseWelshWest IndianYakamaYaquiYugoslavianYumanYup'ikZimbabwean
Immigration
NonimmigrantsImmigrantsAfghanistanAfricaAlbaniaArgentinaArmeniaAsiaAustraliaAustriaBahamasBangladeshBarbadosBelarusBelgiumBelizeBoliviaBosnia and HerzegovinaBrazilBulgariaBurma/MyanmarCabo VerdeCambodiaCameroonCanadaCaribbeanCentral AmericaChileChinaColombiaCongoCosta RicaCroatiaCubaCzechoslovakiaDenmarkDominicaDominican RepublicEastern AfricaEastern AsiaEastern EuropeEcuadorEgyptEl SalvadorEnglandEritreaEthiopiaFijiFranceGermanyGhanaGreeceGrenadaGuatemalaGuyanaHaitiHondurasHong KongHungaryIndiaIndonesiaIranIraqIrelandIsraelItalyJamaicaJapanJordanKazakhstanKenyaKoreaKuwaitLaosLatin AmericaLatviaLebanonLiberiaLithuaniaMalaysiaMexicoMicronesiaMiddle AfricaMoldovaMoroccoNepalNetherlandsNicaraguaNigeriaNorth AmericaNorth MacedoniaNorthern AfricaNorthern EuropeNorwayOceaniaPakistanPanamaPeruPhilippinesPolandPortugalRomaniaRussiaSaudi ArabiaScotlandSenegalSerbiaSierra LeoneSingaporeSomaliaSouth AfricaSouth AmericaSouth Central AsiaSouth Eastern AsiaSouthern EuropeSpainSri LankaSt. Vincent and the GrenadinesSudanSwedenSwitzerlandSyriaTaiwanThailandTrinidad and TobagoTurkeyUgandaUkraineUruguayUzbekistanVenezuelaVietnamWest IndiesWestern AfricaWestern AsiaWestern EuropeYemenZaireZimbabweAzores
Wage/Income Gap
Income
Poverty
Unemployment
Labor Participation
Family Structure
Vehicle Availability
Education Level
Disability

Immigrants from Europe Wage/Income Gap
Tragic

27.1%
WAGE/INCOME GAP
3.8/ 100
METRIC RATING
240th/ 347
METRIC RANK

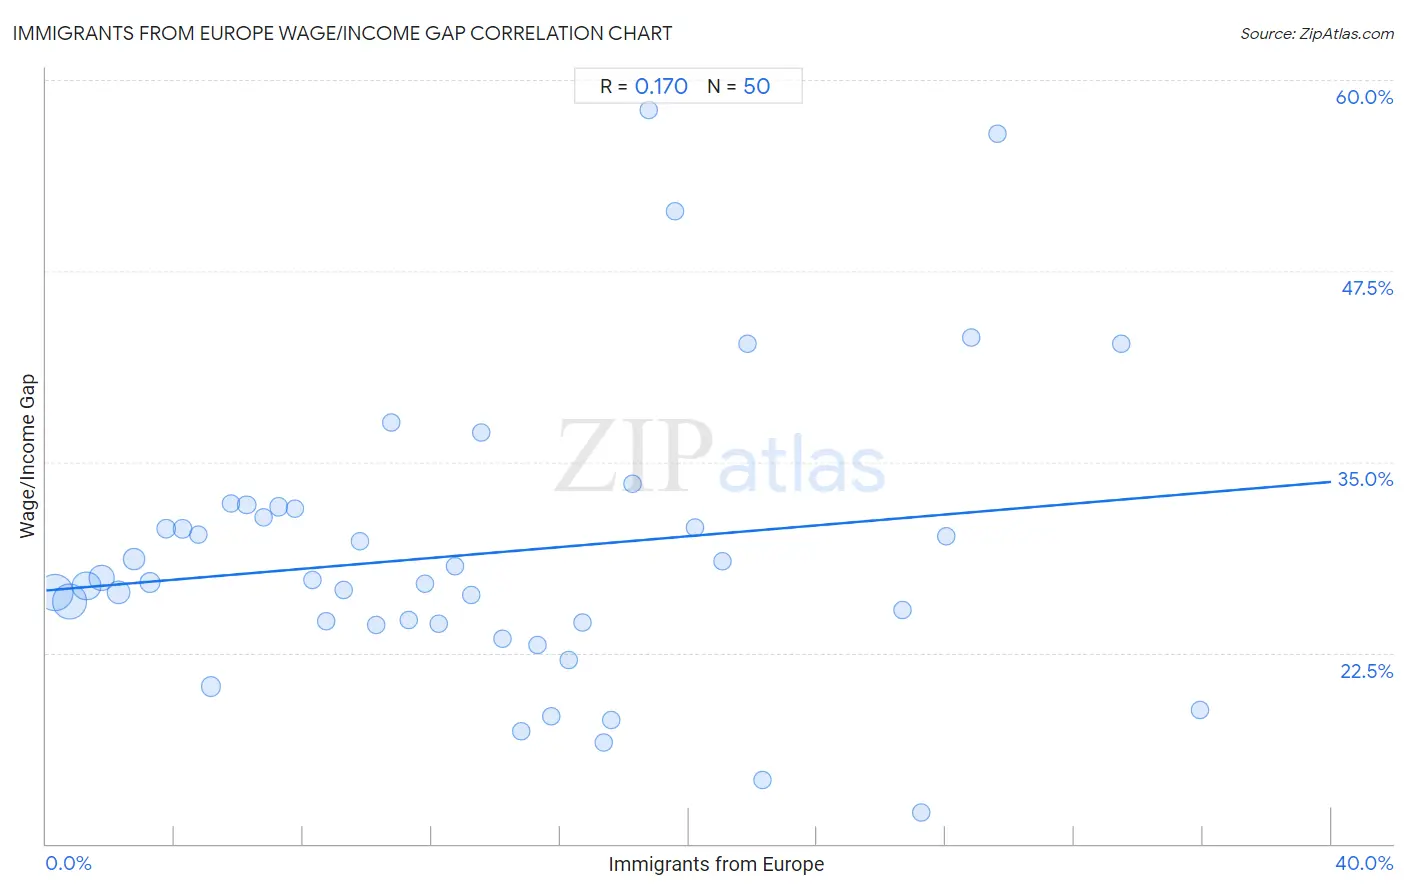
Immigrants from Europe Wage/Income Gap Correlation Chart

The statistical analysis conducted on geographies consisting of 545,787,785 people shows a poor positive correlation between the proportion of Immigrants from Europe and wage/income gap percentage in the United States with a correlation coefficient (R) of 0.170 and weighted average of 27.1%. On average, for every 1% (one percent) increase in Immigrants from Europe within a typical geography, there is an increase of 0.18% in wage/income gap percentage.
Immigrants from Europe Wage/Income Gap
It is essential to understand that the correlation between the percentage of Immigrants from Europe and wage/income gap percentage does not imply a direct cause-and-effect relationship. It remains uncertain whether the presence of Immigrants from Europe influences an upward or downward trend in the level of wage/income gap percentage within an area, or if Immigrants from Europe simply ended up residing in those areas with higher or lower levels of wage/income gap percentage due to other factors.

Demographics Similar to Immigrants from Europe by Wage/Income Gap

In terms of wage/income gap, the demographic groups most similar to Immigrants from Europe are Creek (27.1%, a difference of 0.020%), Immigrants from Sri Lanka (27.1%, a difference of 0.070%), Spanish (27.1%, a difference of 0.080%), Chickasaw (27.2%, a difference of 0.15%), and Immigrants from the Azores (27.2%, a difference of 0.16%).
DemographicsRating | RankWage/Income Gap
Immigrants from Brazil
5.0
/100
|
#233
Tragic
27.0%
Immigrants from Pakistan
4.9
/100
|
#234
Tragic
27.0%
Immigrants from Hungary
4.8
/100
|
#235
Tragic
27.0%
Immigrants from Romania
4.8
/100
|
#236
Tragic
27.0%
Immigrants from Eastern Asia
4.4
/100
|
#237
Tragic
27.1%
Osage
4.4
/100
|
#238
Tragic
27.1%
Estonians
4.3
/100
|
#239
Tragic
27.1%
Immigrants from Europe
3.8
/100
|
#240
Tragic
27.1%
Creek
3.8
/100
|
#241
Tragic
27.1%
Immigrants from Sri Lanka
3.7
/100
|
#242
Tragic
27.1%
Spanish
3.6
/100
|
#243
Tragic
27.1%
Chickasaw
3.5
/100
|
#244
Tragic
27.2%
Immigrants from the Azores
3.5
/100
|
#245
Tragic
27.2%
Nonimmigrants
3.3
/100
|
#246
Tragic
27.2%
Celtics
2.8
/100
|
#247
Tragic
27.3%

Immigrants from Europe Wage/Income Gap Correlation Summary

MeasurementImmigrants from Europe DataWage/Income Gap Data
Minimum0.26%12.1%
Maximum35.9%58.0%
Range35.6%46.0%
Mean13.5%29.0%
Median12.5%27.2%
Interquartile 25% (IQ1)6.2%24.4%
Interquartile 75% (IQ3)18.8%32.0%
Interquartile Range (IQR)12.5%7.6%
Standard Deviation (Sample)9.0%9.5%
Standard Deviation (Population)9.0%9.4%

Correlation Details

Immigrants from Europe PercentileSample SizeWage/Income Gap
[
0.0%
-
0.5%
]
0.26%
142,793,26526.4%
[
0.5%
-
1.0%
]
0.72%
129,726,56625.9%
[
1.0%
-
1.5%
]
1.24%
81,287,54726.9%
[
1.5%
-
2.0%
]
1.72%
50,894,22127.4%
[
2.0%
-
2.5%
]
2.25%
40,350,19426.5%
[
2.5%
-
3.0%
]
2.74%
23,798,74028.6%
[
3.0%
-
3.5%
]
3.25%
18,830,67827.1%
[
3.5%
-
4.0%
]
3.73%
10,663,22830.6%
[
4.0%
-
4.5%
]
4.24%
8,507,37130.6%
[
4.5%
-
5.0%
]
4.73%
5,661,73630.2%
[
5.0%
-
5.5%
]
5.13%
14,287,94620.3%
[
5.5%
-
6.0%
]
5.74%
4,144,42232.3%
[
6.0%
-
6.5%
]
6.24%
2,727,81832.2%
[
6.5%
-
7.0%
]
6.76%
2,523,58731.4%
[
7.0%
-
7.5%
]
7.24%
1,457,81632.1%
[
7.5%
-
8.0%
]
7.74%
1,250,18232.0%
[
8.0%
-
8.5%
]
8.27%
949,19527.3%
[
8.5%
-
9.0%
]
8.72%
832,82524.6%
[
9.0%
-
9.5%
]
9.26%
801,41326.6%
[
9.5%
-
10.0%
]
9.75%
484,87029.8%
[
10.0%
-
10.5%
]
10.28%
640,33624.3%
[
10.5%
-
11.0%
]
10.76%
111,04437.6%
[
11.0%
-
11.5%
]
11.30%
309,04624.6%
[
11.5%
-
12.0%
]
11.77%
486,48527.0%
[
12.0%
-
12.5%
]
12.21%
407,85424.4%
[
12.5%
-
13.0%
]
12.74%
177,33828.2%
[
13.0%
-
13.5%
]
13.21%
286,94726.3%
[
13.5%
-
14.0%
]
13.55%
123,69637.0%
[
14.0%
-
14.5%
]
14.18%
227,33023.4%
[
14.5%
-
15.0%
]
14.80%
140,15017.4%
[
15.0%
-
15.5%
]
15.30%
239,63623.0%
[
15.5%
-
16.0%
]
15.71%
38,26118.3%
[
16.0%
-
16.5%
]
16.25%
53,56022.0%
[
16.5%
-
17.0%
]
16.68%
120,93224.5%
[
17.0%
-
17.5%
]
17.35%
81,10916.6%
[
17.5%
-
18.0%
]
17.60%
2,55118.1%
[
18.0%
-
18.5%
]
18.24%
37,43133.6%
[
18.5%
-
19.0%
]
18.75%
35258.0%
[
19.5%
-
20.0%
]
19.59%
1,50151.4%
[
20.0%
-
20.5%
]
20.18%
65,77430.7%
[
21.0%
-
21.5%
]
21.05%
30,07128.5%
[
21.5%
-
22.0%
]
21.82%
1,96642.7%
[
22.0%
-
22.5%
]
22.30%
2,04914.2%
[
26.5%
-
27.0%
]
26.65%
17,16625.3%
[
27.0%
-
27.5%
]
27.26%
72,29112.1%
[
28.0%
-
28.5%
]
28.03%
23,20030.2%
[
28.5%
-
29.0%
]
28.80%
8,94243.2%
[
29.5%
-
30.0%
]
29.60%
40256.5%
[
33.0%
-
33.5%
]
33.45%
23,67642.7%
[
35.5%
-
36.0%
]
35.90%
83,06918.7%