Immigrants from Ecuador GED/Equivalency
COMPARE
Immigrants from Ecuador
Select to Compare
GED/Equivalency
Immigrants from Ecuador GED/Equivalency
81.0%
GED/EQUIVALENCY
0.0/ 100
METRIC RATING
309th/ 347
METRIC RANK
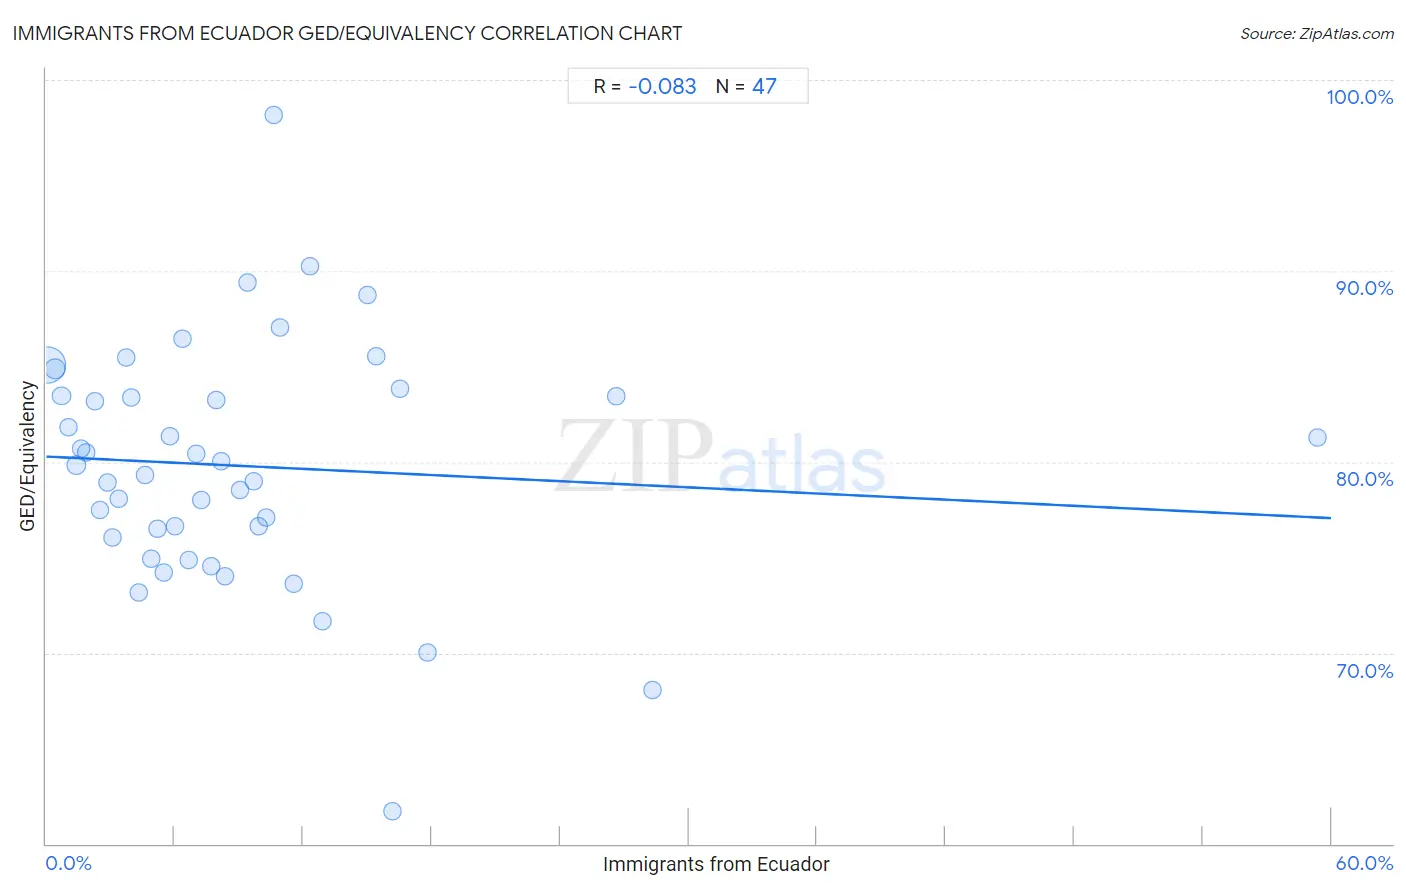
Immigrants from Ecuador GED/Equivalency Correlation Chart
The statistical analysis conducted on geographies consisting of 271,020,679 people shows a slight negative correlation between the proportion of Immigrants from Ecuador and percentage of population with at least ged/equivalency education in the United States with a correlation coefficient (R) of -0.083 and weighted average of 81.0%. On average, for every 1% (one percent) increase in Immigrants from Ecuador within a typical geography, there is a decrease of 0.054% in percentage of population with at least ged/equivalency education.
It is essential to understand that the correlation between the percentage of Immigrants from Ecuador and percentage of population with at least ged/equivalency education does not imply a direct cause-and-effect relationship. It remains uncertain whether the presence of Immigrants from Ecuador influences an upward or downward trend in the level of percentage of population with at least ged/equivalency education within an area, or if Immigrants from Ecuador simply ended up residing in those areas with higher or lower levels of percentage of population with at least ged/equivalency education due to other factors.
Demographics Similar to Immigrants from Ecuador by GED/Equivalency
In terms of ged/equivalency, the demographic groups most similar to Immigrants from Ecuador are Immigrants from Guyana (81.0%, a difference of 0.060%), Native/Alaskan (80.9%, a difference of 0.070%), Puerto Rican (81.1%, a difference of 0.080%), Nicaraguan (80.9%, a difference of 0.10%), and Cape Verdean (80.9%, a difference of 0.10%).
| Demographics | Rating | Rank | GED/Equivalency |
| Immigrants from Haiti | 0.0 /100 | #302 | Tragic 81.6% |
| Immigrants from Portugal | 0.0 /100 | #303 | Tragic 81.6% |
| Navajo | 0.0 /100 | #304 | Tragic 81.5% |
| Immigrants from Grenada | 0.0 /100 | #305 | Tragic 81.3% |
| Guyanese | 0.0 /100 | #306 | Tragic 81.3% |
| Immigrants from Dominica | 0.0 /100 | #307 | Tragic 81.1% |
| Puerto Ricans | 0.0 /100 | #308 | Tragic 81.1% |
| Immigrants from Ecuador | 0.0 /100 | #309 | Tragic 81.0% |
| Immigrants from Guyana | 0.0 /100 | #310 | Tragic 81.0% |
| Natives/Alaskans | 0.0 /100 | #311 | Tragic 80.9% |
| Nicaraguans | 0.0 /100 | #312 | Tragic 80.9% |
| Cape Verdeans | 0.0 /100 | #313 | Tragic 80.9% |
| Belizeans | 0.0 /100 | #314 | Tragic 80.9% |
| Apache | 0.0 /100 | #315 | Tragic 80.7% |
| Central American Indians | 0.0 /100 | #316 | Tragic 80.6% |
Immigrants from Ecuador GED/Equivalency Correlation Summary
| Measurement | Immigrants from Ecuador Data | GED/Equivalency Data |
| Minimum | 0.080% | 61.7% |
| Maximum | 59.4% | 98.2% |
| Range | 59.3% | 36.5% |
| Mean | 9.1% | 79.8% |
| Median | 7.0% | 79.8% |
| Interquartile 25% (IQ1) | 3.4% | 76.0% |
| Interquartile 75% (IQ3) | 10.9% | 83.5% |
| Interquartile Range (IQR) | 7.5% | 7.5% |
| Standard Deviation (Sample) | 9.7% | 6.3% |
| Standard Deviation (Population) | 9.6% | 6.3% |
Correlation Details
| Immigrants from Ecuador Percentile | Sample Size | GED/Equivalency |
[ 0.0% - 0.5% ] 0.080% | 209,815,262 | 85.1% |
[ 0.0% - 0.5% ] 0.42% | 26,073,749 | 84.9% |
[ 0.5% - 1.0% ] 0.73% | 8,423,001 | 83.5% |
[ 1.0% - 1.5% ] 1.03% | 5,756,020 | 81.8% |
[ 1.0% - 1.5% ] 1.42% | 12,136,318 | 79.8% |
[ 1.5% - 2.0% ] 1.61% | 2,095,999 | 80.7% |
[ 1.5% - 2.0% ] 1.88% | 989,953 | 80.5% |
[ 2.0% - 2.5% ] 2.25% | 900,350 | 83.2% |
[ 2.5% - 3.0% ] 2.51% | 615,613 | 77.5% |
[ 2.5% - 3.0% ] 2.84% | 374,254 | 78.9% |
[ 3.0% - 3.5% ] 3.11% | 349,510 | 76.0% |
[ 3.0% - 3.5% ] 3.38% | 171,989 | 78.1% |
[ 3.5% - 4.0% ] 3.71% | 177,201 | 85.5% |
[ 3.5% - 4.0% ] 3.99% | 145,666 | 83.4% |
[ 4.0% - 4.5% ] 4.29% | 203,298 | 73.2% |
[ 4.5% - 5.0% ] 4.62% | 212,515 | 79.3% |
[ 4.5% - 5.0% ] 4.88% | 384,726 | 74.9% |
[ 5.0% - 5.5% ] 5.20% | 108,545 | 76.5% |
[ 5.0% - 5.5% ] 5.46% | 38,623 | 74.2% |
[ 5.5% - 6.0% ] 5.77% | 241,294 | 81.3% |
[ 6.0% - 6.5% ] 6.03% | 506,053 | 76.6% |
[ 6.0% - 6.5% ] 6.37% | 44,256 | 86.5% |
[ 6.5% - 7.0% ] 6.68% | 170,386 | 74.9% |
[ 6.5% - 7.0% ] 7.00% | 87,829 | 80.4% |
[ 7.0% - 7.5% ] 7.24% | 167,696 | 78.0% |
[ 7.5% - 8.0% ] 7.68% | 32,177 | 74.5% |
[ 7.5% - 8.0% ] 7.91% | 128,918 | 83.2% |
[ 8.0% - 8.5% ] 8.14% | 117,803 | 80.1% |
[ 8.0% - 8.5% ] 8.37% | 124,391 | 74.0% |
[ 9.0% - 9.5% ] 9.03% | 58,717 | 78.5% |
[ 9.0% - 9.5% ] 9.41% | 5,864 | 89.4% |
[ 9.5% - 10.0% ] 9.66% | 28,230 | 79.0% |
[ 9.5% - 10.0% ] 9.94% | 79,800 | 76.6% |
[ 10.0% - 10.5% ] 10.30% | 14,649 | 77.1% |
[ 10.5% - 11.0% ] 10.62% | 640 | 98.2% |
[ 10.5% - 11.0% ] 10.89% | 9,283 | 87.0% |
[ 11.5% - 12.0% ] 11.54% | 8,178 | 73.6% |
[ 12.0% - 12.5% ] 12.30% | 21,040 | 90.2% |
[ 12.5% - 13.0% ] 12.90% | 6,951 | 71.6% |
[ 15.0% - 15.5% ] 15.02% | 10,026 | 88.7% |
[ 15.0% - 15.5% ] 15.38% | 4,407 | 85.5% |
[ 16.0% - 16.5% ] 16.14% | 112,750 | 61.7% |
[ 16.5% - 17.0% ] 16.50% | 5,587 | 83.8% |
[ 17.5% - 18.0% ] 17.80% | 57,927 | 70.0% |
[ 26.5% - 27.0% ] 26.60% | 485 | 83.4% |
[ 28.0% - 28.5% ] 28.33% | 2,718 | 68.0% |
[ 59.0% - 59.5% ] 59.38% | 32 | 81.2% |