Immigrants from Ecuador Married-couple Households
COMPARE
Immigrants from Ecuador
Select to Compare
Married-couple Households
Immigrants from Ecuador Married-couple Households
42.9%
MARRIED-COUPLE HOUSEHOLDS
0.0/ 100
METRIC RATING
280th/ 347
METRIC RANK
Immigrants from Ecuador Married-couple Households Correlation Chart
The statistical analysis conducted on geographies consisting of 270,883,052 people shows a significant positive correlation between the proportion of Immigrants from Ecuador and percentage of married-couple family households in the United States with a correlation coefficient (R) of 0.678 and weighted average of 42.9%. On average, for every 1% (one percent) increase in Immigrants from Ecuador within a typical geography, there is an increase of 0.76% in percentage of married-couple family households.
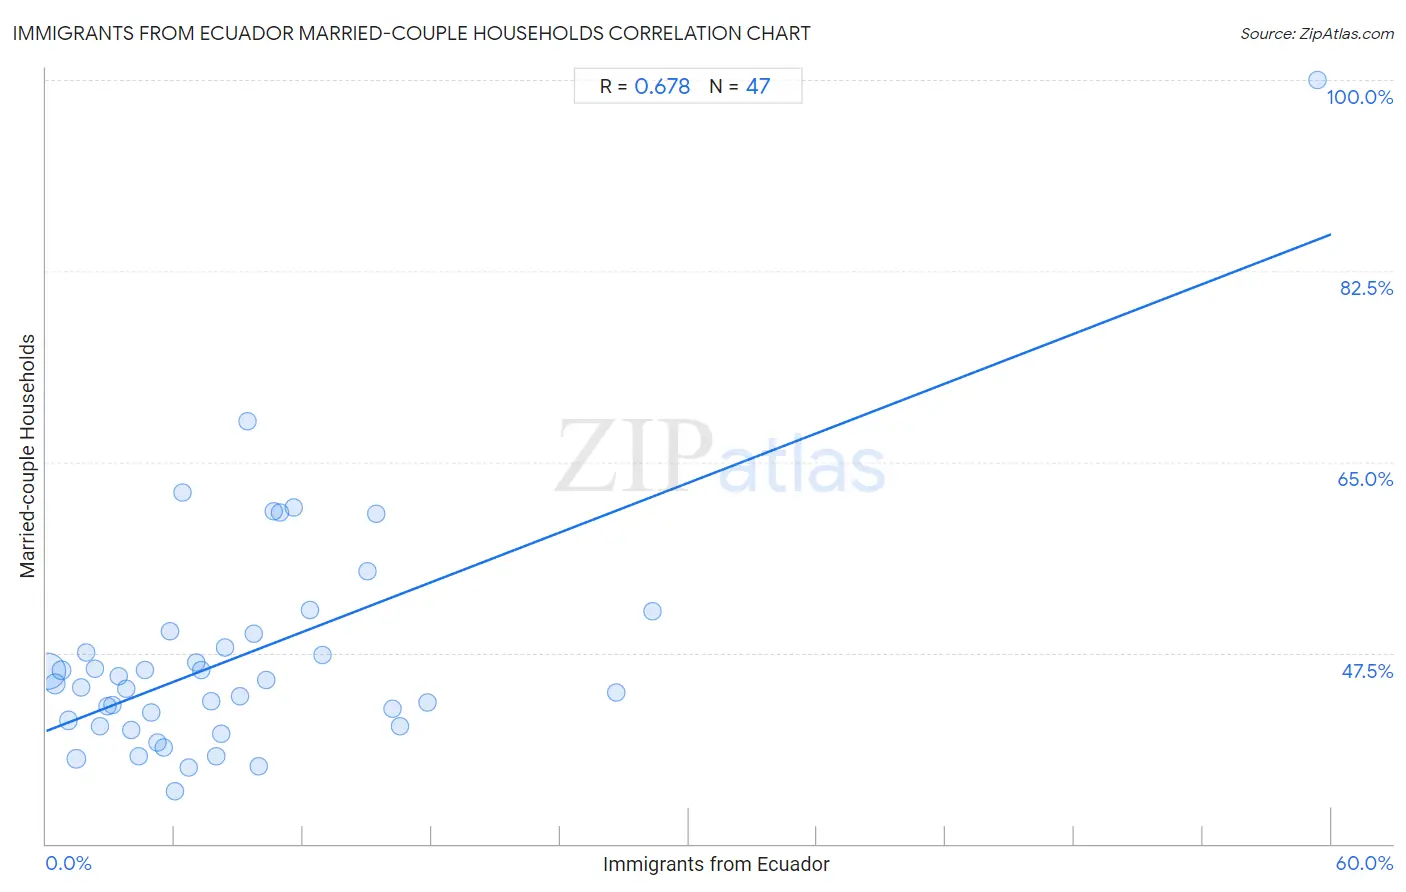
It is essential to understand that the correlation between the percentage of Immigrants from Ecuador and percentage of married-couple family households does not imply a direct cause-and-effect relationship. It remains uncertain whether the presence of Immigrants from Ecuador influences an upward or downward trend in the level of percentage of married-couple family households within an area, or if Immigrants from Ecuador simply ended up residing in those areas with higher or lower levels of percentage of married-couple family households due to other factors.
Demographics Similar to Immigrants from Ecuador by Married-couple Households
In terms of married-couple households, the demographic groups most similar to Immigrants from Ecuador are Sierra Leonean (42.9%, a difference of 0.050%), Immigrants from Guatemala (42.8%, a difference of 0.070%), Immigrants from Africa (42.9%, a difference of 0.080%), Immigrants from Eastern Africa (42.9%, a difference of 0.19%), and Immigrants from Ethiopia (43.1%, a difference of 0.45%).
| Demographics | Rating | Rank | Married-couple Households |
| Ethiopians | 0.1 /100 | #273 | Tragic 43.2% |
| Nigerians | 0.1 /100 | #274 | Tragic 43.2% |
| Immigrants from Bangladesh | 0.0 /100 | #275 | Tragic 43.1% |
| Immigrants from Ethiopia | 0.0 /100 | #276 | Tragic 43.1% |
| Immigrants from Eastern Africa | 0.0 /100 | #277 | Tragic 42.9% |
| Immigrants from Africa | 0.0 /100 | #278 | Tragic 42.9% |
| Sierra Leoneans | 0.0 /100 | #279 | Tragic 42.9% |
| Immigrants from Ecuador | 0.0 /100 | #280 | Tragic 42.9% |
| Immigrants from Guatemala | 0.0 /100 | #281 | Tragic 42.8% |
| Bermudans | 0.0 /100 | #282 | Tragic 42.4% |
| Inupiat | 0.0 /100 | #283 | Tragic 42.4% |
| Cheyenne | 0.0 /100 | #284 | Tragic 42.3% |
| Ghanaians | 0.0 /100 | #285 | Tragic 42.2% |
| Belizeans | 0.0 /100 | #286 | Tragic 42.2% |
| Chippewa | 0.0 /100 | #287 | Tragic 42.1% |
Immigrants from Ecuador Married-couple Households Correlation Summary
| Measurement | Immigrants from Ecuador Data | Married-couple Households Data |
| Minimum | 0.080% | 34.8% |
| Maximum | 59.4% | 100.0% |
| Range | 59.3% | 65.2% |
| Mean | 9.1% | 47.2% |
| Median | 7.0% | 44.7% |
| Interquartile 25% (IQ1) | 3.4% | 40.8% |
| Interquartile 75% (IQ3) | 10.9% | 49.2% |
| Interquartile Range (IQR) | 7.5% | 8.5% |
| Standard Deviation (Sample) | 9.7% | 10.9% |
| Standard Deviation (Population) | 9.6% | 10.8% |
Correlation Details
| Immigrants from Ecuador Percentile | Sample Size | Married-couple Households |
[ 0.0% - 0.5% ] 0.080% | 209,703,904 | 45.8% |
[ 0.0% - 0.5% ] 0.42% | 26,062,091 | 44.7% |
[ 0.5% - 1.0% ] 0.73% | 8,420,567 | 45.9% |
[ 1.0% - 1.5% ] 1.03% | 5,748,434 | 41.3% |
[ 1.0% - 1.5% ] 1.42% | 12,135,239 | 37.8% |
[ 1.5% - 2.0% ] 1.61% | 2,095,819 | 44.3% |
[ 1.5% - 2.0% ] 1.88% | 986,824 | 47.5% |
[ 2.0% - 2.5% ] 2.25% | 900,350 | 46.1% |
[ 2.5% - 3.0% ] 2.51% | 615,613 | 40.8% |
[ 2.5% - 3.0% ] 2.84% | 374,051 | 42.6% |
[ 3.0% - 3.5% ] 3.11% | 349,510 | 42.7% |
[ 3.0% - 3.5% ] 3.38% | 171,989 | 45.3% |
[ 3.5% - 4.0% ] 3.71% | 177,201 | 44.3% |
[ 3.5% - 4.0% ] 3.99% | 145,666 | 40.4% |
[ 4.0% - 4.5% ] 4.29% | 203,298 | 38.1% |
[ 4.5% - 5.0% ] 4.62% | 212,515 | 45.9% |
[ 4.5% - 5.0% ] 4.88% | 384,726 | 42.0% |
[ 5.0% - 5.5% ] 5.20% | 108,545 | 39.3% |
[ 5.0% - 5.5% ] 5.46% | 38,623 | 38.9% |
[ 5.5% - 6.0% ] 5.77% | 241,294 | 49.5% |
[ 6.0% - 6.5% ] 6.03% | 506,053 | 34.8% |
[ 6.0% - 6.5% ] 6.37% | 44,256 | 62.2% |
[ 6.5% - 7.0% ] 6.68% | 170,386 | 36.9% |
[ 6.5% - 7.0% ] 7.00% | 87,829 | 46.6% |
[ 7.0% - 7.5% ] 7.24% | 167,696 | 45.9% |
[ 7.5% - 8.0% ] 7.68% | 32,177 | 43.0% |
[ 7.5% - 8.0% ] 7.91% | 128,918 | 38.1% |
[ 8.0% - 8.5% ] 8.14% | 117,803 | 40.1% |
[ 8.0% - 8.5% ] 8.37% | 124,391 | 48.0% |
[ 9.0% - 9.5% ] 9.03% | 58,717 | 43.5% |
[ 9.0% - 9.5% ] 9.41% | 5,864 | 68.7% |
[ 9.5% - 10.0% ] 9.66% | 28,230 | 49.2% |
[ 9.5% - 10.0% ] 9.94% | 79,800 | 37.1% |
[ 10.0% - 10.5% ] 10.30% | 14,649 | 45.0% |
[ 10.5% - 11.0% ] 10.62% | 640 | 60.5% |
[ 10.5% - 11.0% ] 10.89% | 9,283 | 60.3% |
[ 11.5% - 12.0% ] 11.54% | 8,178 | 60.9% |
[ 12.0% - 12.5% ] 12.30% | 21,040 | 51.4% |
[ 12.5% - 13.0% ] 12.90% | 6,951 | 47.3% |
[ 15.0% - 15.5% ] 15.02% | 10,026 | 55.0% |
[ 15.0% - 15.5% ] 15.38% | 4,407 | 60.3% |
[ 16.0% - 16.5% ] 16.14% | 112,750 | 42.4% |
[ 16.5% - 17.0% ] 16.50% | 5,587 | 40.7% |
[ 17.5% - 18.0% ] 17.80% | 57,927 | 42.9% |
[ 26.5% - 27.0% ] 26.60% | 485 | 43.9% |
[ 28.0% - 28.5% ] 28.33% | 2,718 | 51.3% |
[ 59.0% - 59.5% ] 59.38% | 32 | 100.0% |