Immigrants from Ecuador Married-Couple Family Poverty

COMPARE

Immigrants from Ecuador
Race
Ancestry
AfghanAfricanAlaska NativeAlaskan AthabascanAlbanianAleutAlsatianAmericanApacheArabArapahoArgentineanArmenianAssyrian/Chaldean/SyriacAustralianAustrianBahamianBangladeshiBarbadianBasqueBelgianBelizeanBermudanBhutaneseBlackfeetBolivianBrazilianBritishBritish West IndianBulgarianBurmeseCajunCambodianCanadianCape VerdeanCarpatho RusynCelticCentral AmericanCentral American IndianCherokeeCheyenneChickasawChileanChineseChippewaChoctawColombianColvilleComancheCosta RicanCreeCreekCroatianCrowCubanCypriotCzechCzechoslovakianDanishDelawareDominicanDutchDutch West IndianEastern EuropeanEcuadorianEgyptianEnglishEstonianEthiopianEuropeanFijianFilipinoFinnishFrenchFrench American IndianFrench CanadianGermanGerman RussianGhanaianGreekGuamanian/ChamorroGuatemalanGuyaneseHaitianHmongHonduranHopiHoumaHungarianIcelanderIndian (Asian)IndonesianInupiatIranianIraqiIrishIroquoisIsraeliItalianJamaicanJapaneseJordanianKenyanKiowaKoreanLaotianLatvianLebaneseLiberianLithuanianLumbeeLuxembourgerMacedonianMalaysianMalteseMarshalleseMenomineeMexicanMexican American IndianMongolianMoroccanNative HawaiianNavajoNepaleseNew ZealanderNicaraguanNigerianNorthern EuropeanNorwegianOkinawanOsageOttawaPaiutePakistaniPalestinianPanamanianParaguayanPennsylvania GermanPeruvianPimaPolishPortuguesePotawatomiPuebloPuerto RicanPuget Sound SalishRomanianRussianSalvadoranSamoanScandinavianScotch-IrishScottishSeminoleSenegaleseSerbianShoshoneSierra LeoneanSiouxSlavicSlovakSloveneSomaliSouth AfricanSouth AmericanSouth American IndianSoviet UnionSpaniardSpanishSpanish AmericanSpanish American IndianSri LankanSubsaharan AfricanSudaneseSwedishSwissSyrianTaiwaneseThaiTlingit-HaidaTohono O'OdhamTonganTrinidadian and TobagonianTsimshianTurkishU.S. Virgin IslanderUgandanUkrainianUruguayanUteVenezuelanVietnameseWelshWest IndianYakamaYaquiYugoslavianYumanYup'ikZimbabwean
Immigration
NonimmigrantsImmigrantsAfghanistanAfricaAlbaniaArgentinaArmeniaAsiaAustraliaAustriaBahamasBangladeshBarbadosBelarusBelgiumBelizeBoliviaBosnia and HerzegovinaBrazilBulgariaBurma/MyanmarCabo VerdeCambodiaCameroonCanadaCaribbeanCentral AmericaChileChinaColombiaCongoCosta RicaCroatiaCubaCzechoslovakiaDenmarkDominicaDominican RepublicEastern AfricaEastern AsiaEastern EuropeEcuadorEgyptEl SalvadorEnglandEritreaEthiopiaEuropeFijiFranceGermanyGhanaGreeceGrenadaGuatemalaGuyanaHaitiHondurasHong KongHungaryIndiaIndonesiaIranIraqIrelandIsraelItalyJamaicaJapanJordanKazakhstanKenyaKoreaKuwaitLaosLatin AmericaLatviaLebanonLiberiaLithuaniaMalaysiaMexicoMicronesiaMiddle AfricaMoldovaMoroccoNepalNetherlandsNicaraguaNigeriaNorth AmericaNorth MacedoniaNorthern AfricaNorthern EuropeNorwayOceaniaPakistanPanamaPeruPhilippinesPolandPortugalRomaniaRussiaSaudi ArabiaScotlandSenegalSerbiaSierra LeoneSingaporeSomaliaSouth AfricaSouth AmericaSouth Central AsiaSouth Eastern AsiaSouthern EuropeSpainSri LankaSt. Vincent and the GrenadinesSudanSwedenSwitzerlandSyriaTaiwanThailandTrinidad and TobagoTurkeyUgandaUkraineUruguayUzbekistanVenezuelaVietnamWest IndiesWestern AfricaWestern AsiaWestern EuropeYemenZaireZimbabweAzores
Select to Compare
Race
Ancestry
AfghanAfricanAlaska NativeAlaskan AthabascanAlbanianAleutAlsatianAmericanApacheArabArapahoArgentineanArmenianAssyrian/Chaldean/SyriacAustralianAustrianBahamianBangladeshiBarbadianBasqueBelgianBelizeanBermudanBhutaneseBlackfeetBolivianBrazilianBritishBritish West IndianBulgarianBurmeseCajunCambodianCanadianCape VerdeanCarpatho RusynCelticCentral AmericanCentral American IndianCherokeeCheyenneChickasawChileanChineseChippewaChoctawColombianColvilleComancheCosta RicanCreeCreekCroatianCrowCubanCypriotCzechCzechoslovakianDanishDelawareDominicanDutchDutch West IndianEastern EuropeanEcuadorianEgyptianEnglishEstonianEthiopianEuropeanFijianFilipinoFinnishFrenchFrench American IndianFrench CanadianGermanGerman RussianGhanaianGreekGuamanian/ChamorroGuatemalanGuyaneseHaitianHmongHonduranHopiHoumaHungarianIcelanderIndian (Asian)IndonesianInupiatIranianIraqiIrishIroquoisIsraeliItalianJamaicanJapaneseJordanianKenyanKiowaKoreanLaotianLatvianLebaneseLiberianLithuanianLumbeeLuxembourgerMacedonianMalaysianMalteseMarshalleseMenomineeMexicanMexican American IndianMongolianMoroccanNative HawaiianNavajoNepaleseNew ZealanderNicaraguanNigerianNorthern EuropeanNorwegianOkinawanOsageOttawaPaiutePakistaniPalestinianPanamanianParaguayanPennsylvania GermanPeruvianPimaPolishPortuguesePotawatomiPuebloPuerto RicanPuget Sound SalishRomanianRussianSalvadoranSamoanScandinavianScotch-IrishScottishSeminoleSenegaleseSerbianShoshoneSierra LeoneanSiouxSlavicSlovakSloveneSomaliSouth AfricanSouth AmericanSouth American IndianSoviet UnionSpaniardSpanishSpanish AmericanSpanish American IndianSri LankanSubsaharan AfricanSudaneseSwedishSwissSyrianTaiwaneseThaiTlingit-HaidaTohono O'OdhamTonganTrinidadian and TobagonianTsimshianTurkishU.S. Virgin IslanderUgandanUkrainianUruguayanUteVenezuelanVietnameseWelshWest IndianYakamaYaquiYugoslavianYumanYup'ikZimbabwean
Immigration
NonimmigrantsImmigrantsAfghanistanAfricaAlbaniaArgentinaArmeniaAsiaAustraliaAustriaBahamasBangladeshBarbadosBelarusBelgiumBelizeBoliviaBosnia and HerzegovinaBrazilBulgariaBurma/MyanmarCabo VerdeCambodiaCameroonCanadaCaribbeanCentral AmericaChileChinaColombiaCongoCosta RicaCroatiaCubaCzechoslovakiaDenmarkDominicaDominican RepublicEastern AfricaEastern AsiaEastern EuropeEgyptEl SalvadorEnglandEritreaEthiopiaEuropeFijiFranceGermanyGhanaGreeceGrenadaGuatemalaGuyanaHaitiHondurasHong KongHungaryIndiaIndonesiaIranIraqIrelandIsraelItalyJamaicaJapanJordanKazakhstanKenyaKoreaKuwaitLaosLatin AmericaLatviaLebanonLiberiaLithuaniaMalaysiaMexicoMicronesiaMiddle AfricaMoldovaMoroccoNepalNetherlandsNicaraguaNigeriaNorth AmericaNorth MacedoniaNorthern AfricaNorthern EuropeNorwayOceaniaPakistanPanamaPeruPhilippinesPolandPortugalRomaniaRussiaSaudi ArabiaScotlandSenegalSerbiaSierra LeoneSingaporeSomaliaSouth AfricaSouth AmericaSouth Central AsiaSouth Eastern AsiaSouthern EuropeSpainSri LankaSt. Vincent and the GrenadinesSudanSwedenSwitzerlandSyriaTaiwanThailandTrinidad and TobagoTurkeyUgandaUkraineUruguayUzbekistanVenezuelaVietnamWest IndiesWestern AfricaWestern AsiaWestern EuropeYemenZaireZimbabweAzores
Married-Couple Family Poverty
Income
Poverty
Unemployment
Labor Participation
Family Structure
Vehicle Availability
Education Level
Disability

Immigrants from Ecuador Married-Couple Family Poverty
Tragic

6.7%
POVERTY | MARRIED-COUPLE FAMILIES
0.0/ 100
METRIC RATING
302nd/ 347
METRIC RANK

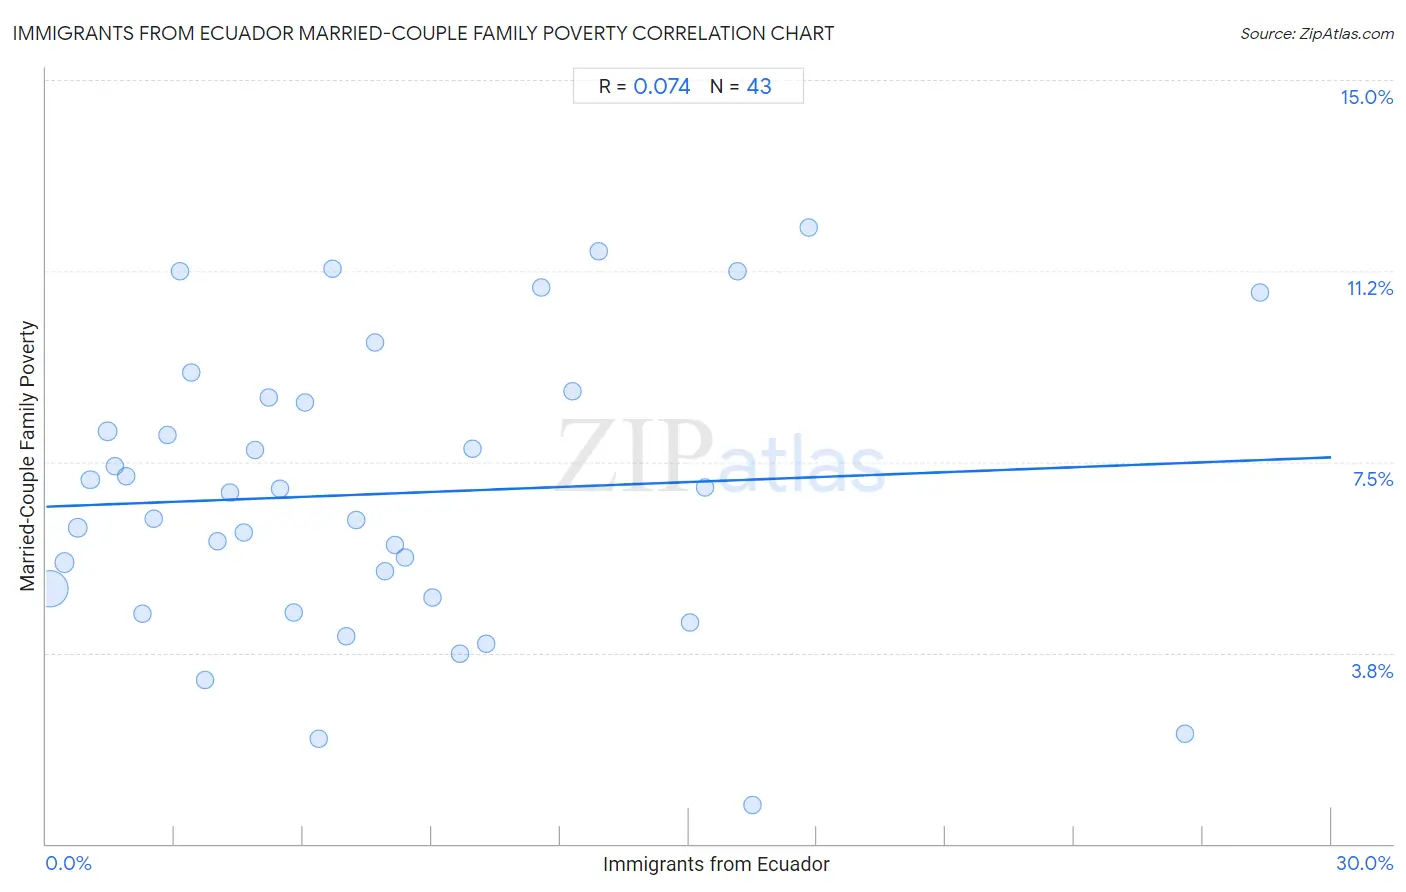
Immigrants from Ecuador Married-Couple Family Poverty Correlation Chart

The statistical analysis conducted on geographies consisting of 269,492,942 people shows a slight positive correlation between the proportion of Immigrants from Ecuador and poverty level among married-couple families in the United States with a correlation coefficient (R) of 0.074 and weighted average of 6.7%. On average, for every 1% (one percent) increase in Immigrants from Ecuador within a typical geography, there is an increase of 0.032% in poverty level among married-couple families.
Immigrants from Ecuador Married-Couple Family Poverty
It is essential to understand that the correlation between the percentage of Immigrants from Ecuador and poverty level among married-couple families does not imply a direct cause-and-effect relationship. It remains uncertain whether the presence of Immigrants from Ecuador influences an upward or downward trend in the level of poverty level among married-couple families within an area, or if Immigrants from Ecuador simply ended up residing in those areas with higher or lower levels of poverty level among married-couple families due to other factors.

Demographics Similar to Immigrants from Ecuador by Married-Couple Family Poverty

In terms of married-couple family poverty, the demographic groups most similar to Immigrants from Ecuador are Central American (6.7%, a difference of 0.14%), Immigrants from El Salvador (6.8%, a difference of 0.28%), Cuban (6.8%, a difference of 0.72%), Immigrants from Belize (6.7%, a difference of 0.74%), and Haitian (6.8%, a difference of 0.83%).
DemographicsRating | RankMarried-Couple Family Poverty
Immigrants from Uzbekistan
0.0
/100
|
#295
Tragic
6.6%
U.S. Virgin Islanders
0.0
/100
|
#296
Tragic
6.6%
Kiowa
0.0
/100
|
#297
Tragic
6.6%
Immigrants from Guyana
0.0
/100
|
#298
Tragic
6.7%
Nicaraguans
0.0
/100
|
#299
Tragic
6.7%
Immigrants from Belize
0.0
/100
|
#300
Tragic
6.7%
Central Americans
0.0
/100
|
#301
Tragic
6.7%
Immigrants from Ecuador
0.0
/100
|
#302
Tragic
6.7%
Immigrants from El Salvador
0.0
/100
|
#303
Tragic
6.8%
Cubans
0.0
/100
|
#304
Tragic
6.8%
Haitians
0.0
/100
|
#305
Tragic
6.8%
Immigrants from Haiti
0.0
/100
|
#306
Tragic
7.0%
Guatemalans
0.0
/100
|
#307
Tragic
7.0%
Spanish American Indians
0.0
/100
|
#308
Tragic
7.1%
Hopi
0.0
/100
|
#309
Tragic
7.1%

Immigrants from Ecuador Married-Couple Family Poverty Correlation Summary

MeasurementImmigrants from Ecuador DataMarried-Couple Family Poverty Data
Minimum0.080%0.76%
Maximum28.3%12.1%
Range28.2%11.3%
Mean7.8%6.9%
Median6.4%6.9%
Interquartile 25% (IQ1)3.1%4.8%
Interquartile 75% (IQ3)10.3%8.8%
Interquartile Range (IQR)7.2%3.9%
Standard Deviation (Sample)6.4%2.8%
Standard Deviation (Population)6.4%2.8%

Correlation Details

Immigrants from Ecuador PercentileSample SizeMarried-Couple Family Poverty
[
0.0%
-
0.5%
]
0.080%
209,062,9585.0%
[
0.0%
-
0.5%
]
0.42%
25,727,2485.5%
[
0.5%
-
1.0%
]
0.73%
8,300,6606.2%
[
1.0%
-
1.5%
]
1.03%
5,675,4307.1%
[
1.0%
-
1.5%
]
1.42%
12,078,8028.1%
[
1.5%
-
2.0%
]
1.60%
2,080,7287.4%
[
1.5%
-
2.0%
]
1.88%
955,9247.2%
[
2.0%
-
2.5%
]
2.26%
874,3424.5%
[
2.5%
-
3.0%
]
2.51%
610,0646.4%
[
2.5%
-
3.0%
]
2.84%
358,6278.0%
[
3.0%
-
3.5%
]
3.11%
346,83811.2%
[
3.0%
-
3.5%
]
3.37%
160,7619.2%
[
3.5%
-
4.0%
]
3.71%
174,9323.2%
[
3.5%
-
4.0%
]
3.99%
136,2776.0%
[
4.0%
-
4.5%
]
4.29%
203,2986.9%
[
4.5%
-
5.0%
]
4.62%
211,0976.1%
[
4.5%
-
5.0%
]
4.88%
380,8557.7%
[
5.0%
-
5.5%
]
5.20%
108,0918.8%
[
5.0%
-
5.5%
]
5.46%
36,6577.0%
[
5.5%
-
6.0%
]
5.77%
236,1024.6%
[
6.0%
-
6.5%
]
6.03%
498,8708.7%
[
6.0%
-
6.5%
]
6.37%
43,2242.1%
[
6.5%
-
7.0%
]
6.68%
168,21611.3%
[
6.5%
-
7.0%
]
7.00%
86,4564.1%
[
7.0%
-
7.5%
]
7.24%
165,9846.4%
[
7.5%
-
8.0%
]
7.68%
32,1779.8%
[
7.5%
-
8.0%
]
7.91%
128,9185.4%
[
8.0%
-
8.5%
]
8.14%
117,8035.9%
[
8.0%
-
8.5%
]
8.37%
124,3915.6%
[
9.0%
-
9.5%
]
9.03%
58,7174.8%
[
9.5%
-
10.0%
]
9.66%
28,2303.7%
[
9.5%
-
10.0%
]
9.94%
79,8007.8%
[
10.0%
-
10.5%
]
10.28%
10,3963.9%
[
11.5%
-
12.0%
]
11.54%
8,17810.9%
[
12.0%
-
12.5%
]
12.30%
21,0408.9%
[
12.5%
-
13.0%
]
12.90%
6,95111.6%
[
15.0%
-
15.5%
]
15.02%
10,0264.3%
[
15.0%
-
15.5%
]
15.38%
4,4077.0%
[
16.0%
-
16.5%
]
16.14%
112,75011.2%
[
16.5%
-
17.0%
]
16.50%
5,5870.76%
[
17.5%
-
18.0%
]
17.80%
57,92712.1%
[
26.5%
-
27.0%
]
26.60%
4852.2%
[
28.0%
-
28.5%
]
28.33%
2,71810.8%