Immigrants from Ecuador Wage/Income Gap

COMPARE

Immigrants from Ecuador
Race
Ancestry
AfghanAfricanAlaska NativeAlaskan AthabascanAlbanianAleutAlsatianAmericanApacheArabArapahoArgentineanArmenianAssyrian/Chaldean/SyriacAustralianAustrianBahamianBangladeshiBarbadianBasqueBelgianBelizeanBermudanBhutaneseBlackfeetBolivianBrazilianBritishBritish West IndianBulgarianBurmeseCajunCambodianCanadianCape VerdeanCarpatho RusynCelticCentral AmericanCentral American IndianCherokeeCheyenneChickasawChileanChineseChippewaChoctawColombianColvilleComancheCosta RicanCreeCreekCroatianCrowCubanCypriotCzechCzechoslovakianDanishDelawareDominicanDutchDutch West IndianEastern EuropeanEcuadorianEgyptianEnglishEstonianEthiopianEuropeanFijianFilipinoFinnishFrenchFrench American IndianFrench CanadianGermanGerman RussianGhanaianGreekGuamanian/ChamorroGuatemalanGuyaneseHaitianHmongHonduranHopiHoumaHungarianIcelanderIndian (Asian)IndonesianInupiatIranianIraqiIrishIroquoisIsraeliItalianJamaicanJapaneseJordanianKenyanKiowaKoreanLaotianLatvianLebaneseLiberianLithuanianLumbeeLuxembourgerMacedonianMalaysianMalteseMarshalleseMenomineeMexicanMexican American IndianMongolianMoroccanNative HawaiianNavajoNepaleseNew ZealanderNicaraguanNigerianNorthern EuropeanNorwegianOkinawanOsageOttawaPaiutePakistaniPalestinianPanamanianParaguayanPennsylvania GermanPeruvianPimaPolishPortuguesePotawatomiPuebloPuerto RicanPuget Sound SalishRomanianRussianSalvadoranSamoanScandinavianScotch-IrishScottishSeminoleSenegaleseSerbianShoshoneSierra LeoneanSiouxSlavicSlovakSloveneSomaliSouth AfricanSouth AmericanSouth American IndianSoviet UnionSpaniardSpanishSpanish AmericanSpanish American IndianSri LankanSubsaharan AfricanSudaneseSwedishSwissSyrianTaiwaneseThaiTlingit-HaidaTohono O'OdhamTonganTrinidadian and TobagonianTsimshianTurkishU.S. Virgin IslanderUgandanUkrainianUruguayanUteVenezuelanVietnameseWelshWest IndianYakamaYaquiYugoslavianYumanYup'ikZimbabwean
Immigration
NonimmigrantsImmigrantsAfghanistanAfricaAlbaniaArgentinaArmeniaAsiaAustraliaAustriaBahamasBangladeshBarbadosBelarusBelgiumBelizeBoliviaBosnia and HerzegovinaBrazilBulgariaBurma/MyanmarCabo VerdeCambodiaCameroonCanadaCaribbeanCentral AmericaChileChinaColombiaCongoCosta RicaCroatiaCubaCzechoslovakiaDenmarkDominicaDominican RepublicEastern AfricaEastern AsiaEastern EuropeEcuadorEgyptEl SalvadorEnglandEritreaEthiopiaEuropeFijiFranceGermanyGhanaGreeceGrenadaGuatemalaGuyanaHaitiHondurasHong KongHungaryIndiaIndonesiaIranIraqIrelandIsraelItalyJamaicaJapanJordanKazakhstanKenyaKoreaKuwaitLaosLatin AmericaLatviaLebanonLiberiaLithuaniaMalaysiaMexicoMicronesiaMiddle AfricaMoldovaMoroccoNepalNetherlandsNicaraguaNigeriaNorth AmericaNorth MacedoniaNorthern AfricaNorthern EuropeNorwayOceaniaPakistanPanamaPeruPhilippinesPolandPortugalRomaniaRussiaSaudi ArabiaScotlandSenegalSerbiaSierra LeoneSingaporeSomaliaSouth AfricaSouth AmericaSouth Central AsiaSouth Eastern AsiaSouthern EuropeSpainSri LankaSt. Vincent and the GrenadinesSudanSwedenSwitzerlandSyriaTaiwanThailandTrinidad and TobagoTurkeyUgandaUkraineUruguayUzbekistanVenezuelaVietnamWest IndiesWestern AfricaWestern AsiaWestern EuropeYemenZaireZimbabweAzores
Select to Compare
Race
Ancestry
AfghanAfricanAlaska NativeAlaskan AthabascanAlbanianAleutAlsatianAmericanApacheArabArapahoArgentineanArmenianAssyrian/Chaldean/SyriacAustralianAustrianBahamianBangladeshiBarbadianBasqueBelgianBelizeanBermudanBhutaneseBlackfeetBolivianBrazilianBritishBritish West IndianBulgarianBurmeseCajunCambodianCanadianCape VerdeanCarpatho RusynCelticCentral AmericanCentral American IndianCherokeeCheyenneChickasawChileanChineseChippewaChoctawColombianColvilleComancheCosta RicanCreeCreekCroatianCrowCubanCypriotCzechCzechoslovakianDanishDelawareDominicanDutchDutch West IndianEastern EuropeanEcuadorianEgyptianEnglishEstonianEthiopianEuropeanFijianFilipinoFinnishFrenchFrench American IndianFrench CanadianGermanGerman RussianGhanaianGreekGuamanian/ChamorroGuatemalanGuyaneseHaitianHmongHonduranHopiHoumaHungarianIcelanderIndian (Asian)IndonesianInupiatIranianIraqiIrishIroquoisIsraeliItalianJamaicanJapaneseJordanianKenyanKiowaKoreanLaotianLatvianLebaneseLiberianLithuanianLumbeeLuxembourgerMacedonianMalaysianMalteseMarshalleseMenomineeMexicanMexican American IndianMongolianMoroccanNative HawaiianNavajoNepaleseNew ZealanderNicaraguanNigerianNorthern EuropeanNorwegianOkinawanOsageOttawaPaiutePakistaniPalestinianPanamanianParaguayanPennsylvania GermanPeruvianPimaPolishPortuguesePotawatomiPuebloPuerto RicanPuget Sound SalishRomanianRussianSalvadoranSamoanScandinavianScotch-IrishScottishSeminoleSenegaleseSerbianShoshoneSierra LeoneanSiouxSlavicSlovakSloveneSomaliSouth AfricanSouth AmericanSouth American IndianSoviet UnionSpaniardSpanishSpanish AmericanSpanish American IndianSri LankanSubsaharan AfricanSudaneseSwedishSwissSyrianTaiwaneseThaiTlingit-HaidaTohono O'OdhamTonganTrinidadian and TobagonianTsimshianTurkishU.S. Virgin IslanderUgandanUkrainianUruguayanUteVenezuelanVietnameseWelshWest IndianYakamaYaquiYugoslavianYumanYup'ikZimbabwean
Immigration
NonimmigrantsImmigrantsAfghanistanAfricaAlbaniaArgentinaArmeniaAsiaAustraliaAustriaBahamasBangladeshBarbadosBelarusBelgiumBelizeBoliviaBosnia and HerzegovinaBrazilBulgariaBurma/MyanmarCabo VerdeCambodiaCameroonCanadaCaribbeanCentral AmericaChileChinaColombiaCongoCosta RicaCroatiaCubaCzechoslovakiaDenmarkDominicaDominican RepublicEastern AfricaEastern AsiaEastern EuropeEgyptEl SalvadorEnglandEritreaEthiopiaEuropeFijiFranceGermanyGhanaGreeceGrenadaGuatemalaGuyanaHaitiHondurasHong KongHungaryIndiaIndonesiaIranIraqIrelandIsraelItalyJamaicaJapanJordanKazakhstanKenyaKoreaKuwaitLaosLatin AmericaLatviaLebanonLiberiaLithuaniaMalaysiaMexicoMicronesiaMiddle AfricaMoldovaMoroccoNepalNetherlandsNicaraguaNigeriaNorth AmericaNorth MacedoniaNorthern AfricaNorthern EuropeNorwayOceaniaPakistanPanamaPeruPhilippinesPolandPortugalRomaniaRussiaSaudi ArabiaScotlandSenegalSerbiaSierra LeoneSingaporeSomaliaSouth AfricaSouth AmericaSouth Central AsiaSouth Eastern AsiaSouthern EuropeSpainSri LankaSt. Vincent and the GrenadinesSudanSwedenSwitzerlandSyriaTaiwanThailandTrinidad and TobagoTurkeyUgandaUkraineUruguayUzbekistanVenezuelaVietnamWest IndiesWestern AfricaWestern AsiaWestern EuropeYemenZaireZimbabweAzores
Wage/Income Gap
Income
Poverty
Unemployment
Labor Participation
Family Structure
Vehicle Availability
Education Level
Disability

Immigrants from Ecuador Wage/Income Gap
Exceptional

22.5%
WAGE/INCOME GAP
100.0/ 100
METRIC RATING
63rd/ 347
METRIC RANK

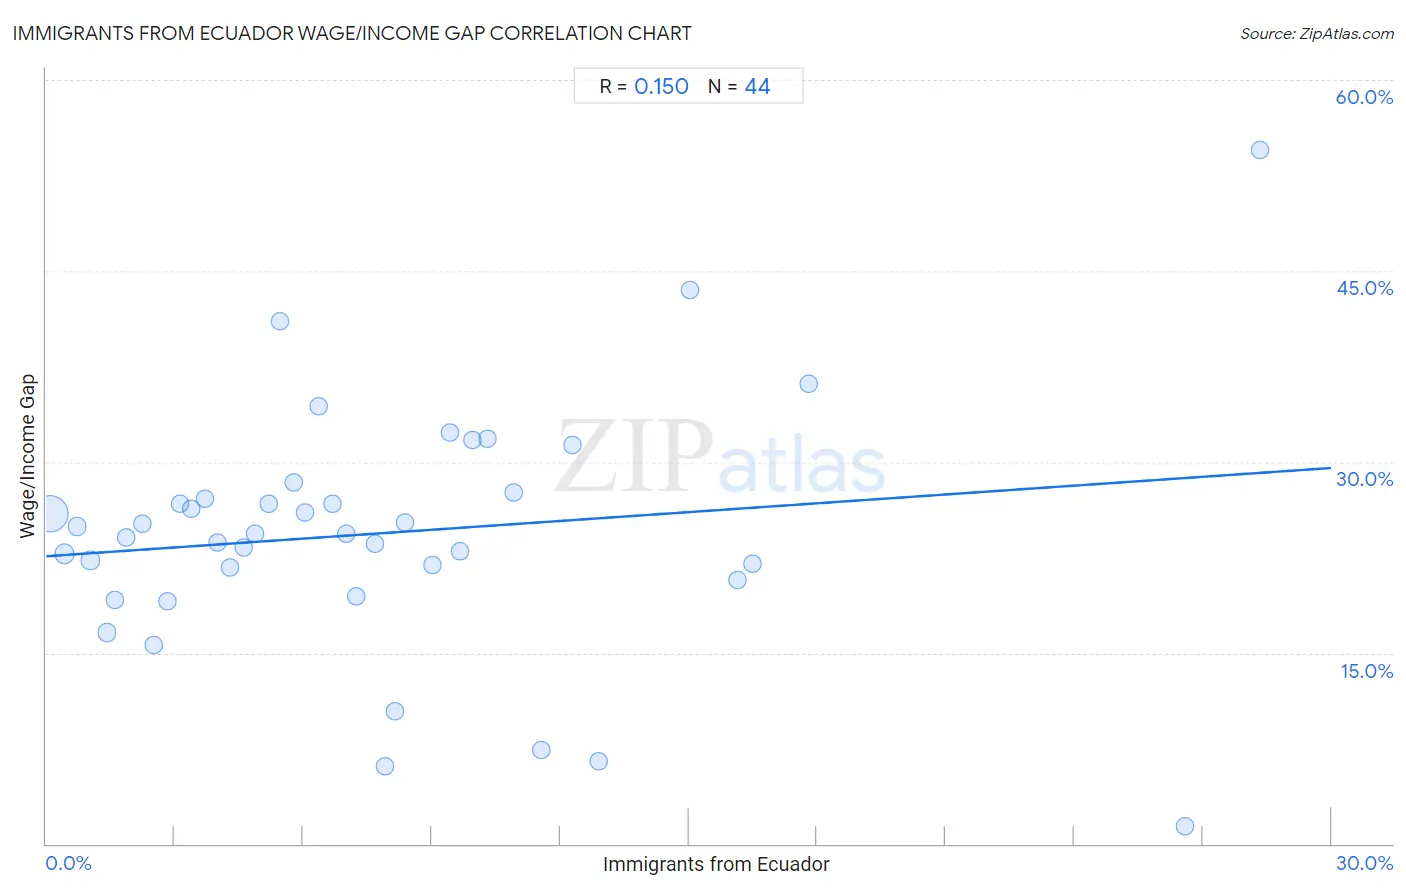
Immigrants from Ecuador Wage/Income Gap Correlation Chart

The statistical analysis conducted on geographies consisting of 270,894,682 people shows a poor positive correlation between the proportion of Immigrants from Ecuador and wage/income gap percentage in the United States with a correlation coefficient (R) of 0.150 and weighted average of 22.5%. On average, for every 1% (one percent) increase in Immigrants from Ecuador within a typical geography, there is an increase of 0.23% in wage/income gap percentage.
Immigrants from Ecuador Wage/Income Gap
It is essential to understand that the correlation between the percentage of Immigrants from Ecuador and wage/income gap percentage does not imply a direct cause-and-effect relationship. It remains uncertain whether the presence of Immigrants from Ecuador influences an upward or downward trend in the level of wage/income gap percentage within an area, or if Immigrants from Ecuador simply ended up residing in those areas with higher or lower levels of wage/income gap percentage due to other factors.

Demographics Similar to Immigrants from Ecuador by Wage/Income Gap

In terms of wage/income gap, the demographic groups most similar to Immigrants from Ecuador are Immigrants from Guatemala (22.5%, a difference of 0.14%), Spanish American Indian (22.5%, a difference of 0.29%), Immigrants from Fiji (22.4%, a difference of 0.35%), Immigrants from Middle Africa (22.4%, a difference of 0.52%), and Navajo (22.4%, a difference of 0.54%).
DemographicsRating | RankWage/Income Gap
Immigrants from Ghana
100.0
/100
|
#56
Exceptional
22.3%
Ghanaians
100.0
/100
|
#57
Exceptional
22.3%
Immigrants from Cuba
100.0
/100
|
#58
Exceptional
22.4%
Navajo
100.0
/100
|
#59
Exceptional
22.4%
Immigrants from Middle Africa
100.0
/100
|
#60
Exceptional
22.4%
Immigrants from Fiji
100.0
/100
|
#61
Exceptional
22.4%
Immigrants from Guatemala
100.0
/100
|
#62
Exceptional
22.5%
Immigrants from Ecuador
100.0
/100
|
#63
Exceptional
22.5%
Spanish American Indians
100.0
/100
|
#64
Exceptional
22.5%
Guatemalans
99.9
/100
|
#65
Exceptional
22.6%
Central American Indians
99.9
/100
|
#66
Exceptional
22.7%
Menominee
99.9
/100
|
#67
Exceptional
22.7%
Immigrants from Nigeria
99.9
/100
|
#68
Exceptional
22.7%
Indonesians
99.9
/100
|
#69
Exceptional
22.7%
Immigrants from Uzbekistan
99.9
/100
|
#70
Exceptional
22.7%

Immigrants from Ecuador Wage/Income Gap Correlation Summary

MeasurementImmigrants from Ecuador DataWage/Income Gap Data
Minimum0.080%1.4%
Maximum28.3%54.5%
Range28.2%53.1%
Mean7.7%24.4%
Median6.5%24.4%
Interquartile 25% (IQ1)3.2%21.2%
Interquartile 75% (IQ3)10.1%27.3%
Interquartile Range (IQR)6.9%6.1%
Standard Deviation (Sample)6.3%9.6%
Standard Deviation (Population)6.2%9.5%

Correlation Details

Immigrants from Ecuador PercentileSample SizeWage/Income Gap
[
0.0%
-
0.5%
]
0.080%
209,789,29625.9%
[
0.0%
-
0.5%
]
0.42%
26,032,12322.7%
[
0.5%
-
1.0%
]
0.73%
8,404,13724.9%
[
1.0%
-
1.5%
]
1.03%
5,748,58422.2%
[
1.0%
-
1.5%
]
1.42%
12,132,47616.6%
[
1.5%
-
2.0%
]
1.61%
2,093,94619.2%
[
1.5%
-
2.0%
]
1.88%
986,82424.1%
[
2.0%
-
2.5%
]
2.25%
898,84725.1%
[
2.5%
-
3.0%
]
2.51%
615,49215.6%
[
2.5%
-
3.0%
]
2.84%
374,05119.0%
[
3.0%
-
3.5%
]
3.11%
347,70026.7%
[
3.0%
-
3.5%
]
3.38%
170,74826.3%
[
3.5%
-
4.0%
]
3.71%
175,90827.1%
[
3.5%
-
4.0%
]
3.99%
145,66623.6%
[
4.0%
-
4.5%
]
4.29%
203,29821.7%
[
4.5%
-
5.0%
]
4.62%
212,51523.3%
[
4.5%
-
5.0%
]
4.88%
384,72624.4%
[
5.0%
-
5.5%
]
5.20%
107,36526.7%
[
5.0%
-
5.5%
]
5.46%
36,75041.0%
[
5.5%
-
6.0%
]
5.77%
241,29428.3%
[
6.0%
-
6.5%
]
6.03%
500,01026.0%
[
6.0%
-
6.5%
]
6.37%
43,22434.3%
[
6.5%
-
7.0%
]
6.68%
170,38626.8%
[
7.0%
-
7.5%
]
7.00%
87,54024.4%
[
7.0%
-
7.5%
]
7.24%
167,69619.4%
[
7.5%
-
8.0%
]
7.68%
32,17723.5%
[
7.5%
-
8.0%
]
7.91%
128,9186.1%
[
8.0%
-
8.5%
]
8.14%
117,80310.4%
[
8.0%
-
8.5%
]
8.37%
124,39125.2%
[
9.0%
-
9.5%
]
9.03%
58,71721.9%
[
9.0%
-
9.5%
]
9.41%
5,86432.3%
[
9.5%
-
10.0%
]
9.66%
28,23023.0%
[
9.5%
-
10.0%
]
9.94%
79,80031.7%
[
10.0%
-
10.5%
]
10.30%
14,64931.8%
[
10.5%
-
11.0%
]
10.90%
8,65127.6%
[
11.5%
-
12.0%
]
11.54%
8,1787.4%
[
12.0%
-
12.5%
]
12.30%
21,04031.3%
[
12.5%
-
13.0%
]
12.90%
6,1696.5%
[
15.0%
-
15.5%
]
15.02%
10,02643.5%
[
16.0%
-
16.5%
]
16.14%
112,75020.7%
[
16.5%
-
17.0%
]
16.50%
5,58722.0%
[
17.5%
-
18.0%
]
17.80%
57,92736.2%
[
26.5%
-
27.0%
]
26.60%
4851.4%
[
28.0%
-
28.5%
]
28.33%
2,71854.5%