Immigrants from Ecuador Self-Care Disability
COMPARE
Immigrants from Ecuador
Select to Compare
Self-Care Disability
Immigrants from Ecuador Self-Care Disability
2.6%
SELF-CARE DISABILITY
2.5/ 100
METRIC RATING
230th/ 347
METRIC RANK
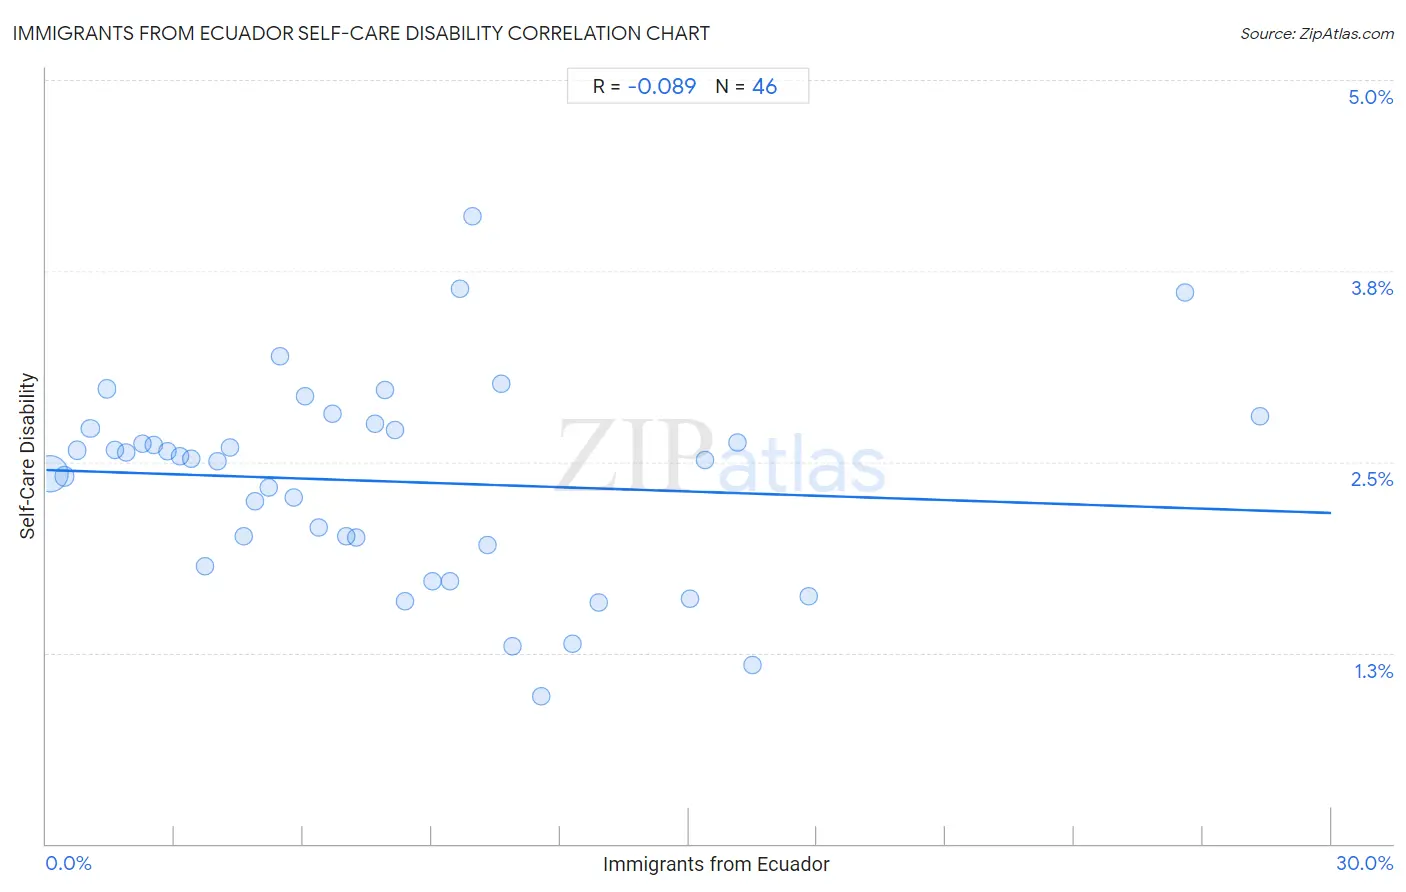
Immigrants from Ecuador Self-Care Disability Correlation Chart
The statistical analysis conducted on geographies consisting of 270,835,557 people shows a slight negative correlation between the proportion of Immigrants from Ecuador and percentage of population with self-care disability in the United States with a correlation coefficient (R) of -0.089 and weighted average of 2.6%. On average, for every 1% (one percent) increase in Immigrants from Ecuador within a typical geography, there is a decrease of 0.0094% in percentage of population with self-care disability.
It is essential to understand that the correlation between the percentage of Immigrants from Ecuador and percentage of population with self-care disability does not imply a direct cause-and-effect relationship. It remains uncertain whether the presence of Immigrants from Ecuador influences an upward or downward trend in the level of percentage of population with self-care disability within an area, or if Immigrants from Ecuador simply ended up residing in those areas with higher or lower levels of percentage of population with self-care disability due to other factors.
Demographics Similar to Immigrants from Ecuador by Self-Care Disability
In terms of self-care disability, the demographic groups most similar to Immigrants from Ecuador are Guamanian/Chamorro (2.6%, a difference of 0.010%), Immigrants from Philippines (2.6%, a difference of 0.080%), Guatemalan (2.6%, a difference of 0.080%), Immigrants from Guatemala (2.6%, a difference of 0.15%), and Chinese (2.6%, a difference of 0.16%).
| Demographics | Rating | Rank | Self-Care Disability |
| French Canadians | 3.8 /100 | #223 | Tragic 2.6% |
| Osage | 3.6 /100 | #224 | Tragic 2.6% |
| Iraqis | 3.2 /100 | #225 | Tragic 2.6% |
| Chinese | 2.9 /100 | #226 | Tragic 2.6% |
| Immigrants from Philippines | 2.7 /100 | #227 | Tragic 2.6% |
| Guatemalans | 2.7 /100 | #228 | Tragic 2.6% |
| Guamanians/Chamorros | 2.5 /100 | #229 | Tragic 2.6% |
| Immigrants from Ecuador | 2.5 /100 | #230 | Tragic 2.6% |
| Immigrants from Guatemala | 2.2 /100 | #231 | Tragic 2.6% |
| Albanians | 2.2 /100 | #232 | Tragic 2.6% |
| Liberians | 2.1 /100 | #233 | Tragic 2.6% |
| Vietnamese | 2.1 /100 | #234 | Tragic 2.6% |
| Bahamians | 2.0 /100 | #235 | Tragic 2.6% |
| Bermudans | 1.9 /100 | #236 | Tragic 2.6% |
| Immigrants from Senegal | 1.6 /100 | #237 | Tragic 2.6% |
Immigrants from Ecuador Self-Care Disability Correlation Summary
| Measurement | Immigrants from Ecuador Data | Self-Care Disability Data |
| Minimum | 0.080% | 0.96% |
| Maximum | 28.3% | 4.1% |
| Range | 28.2% | 3.1% |
| Mean | 8.0% | 2.4% |
| Median | 6.8% | 2.5% |
| Interquartile 25% (IQ1) | 3.4% | 2.0% |
| Interquartile 75% (IQ3) | 10.6% | 2.7% |
| Interquartile Range (IQR) | 7.2% | 0.76% |
| Standard Deviation (Sample) | 6.3% | 0.66% |
| Standard Deviation (Population) | 6.2% | 0.65% |
Correlation Details
| Immigrants from Ecuador Percentile | Sample Size | Self-Care Disability |
[ 0.0% - 0.5% ] 0.080% | 209,700,827 | 2.4% |
[ 0.0% - 0.5% ] 0.42% | 26,047,926 | 2.4% |
[ 0.5% - 1.0% ] 0.73% | 8,417,683 | 2.6% |
[ 1.0% - 1.5% ] 1.03% | 5,734,978 | 2.7% |
[ 1.0% - 1.5% ] 1.42% | 12,133,641 | 3.0% |
[ 1.5% - 2.0% ] 1.61% | 2,095,819 | 2.6% |
[ 1.5% - 2.0% ] 1.88% | 984,557 | 2.6% |
[ 2.0% - 2.5% ] 2.25% | 898,847 | 2.6% |
[ 2.5% - 3.0% ] 2.51% | 615,613 | 2.6% |
[ 2.5% - 3.0% ] 2.84% | 374,051 | 2.6% |
[ 3.0% - 3.5% ] 3.11% | 349,510 | 2.5% |
[ 3.0% - 3.5% ] 3.38% | 171,989 | 2.5% |
[ 3.5% - 4.0% ] 3.71% | 176,732 | 1.8% |
[ 3.5% - 4.0% ] 3.99% | 145,666 | 2.5% |
[ 4.0% - 4.5% ] 4.29% | 203,298 | 2.6% |
[ 4.5% - 5.0% ] 4.62% | 212,515 | 2.0% |
[ 4.5% - 5.0% ] 4.88% | 384,118 | 2.2% |
[ 5.0% - 5.5% ] 5.20% | 108,091 | 2.3% |
[ 5.0% - 5.5% ] 5.46% | 36,657 | 3.2% |
[ 5.5% - 6.0% ] 5.77% | 240,766 | 2.3% |
[ 6.0% - 6.5% ] 6.03% | 505,745 | 2.9% |
[ 6.0% - 6.5% ] 6.37% | 44,256 | 2.1% |
[ 6.5% - 7.0% ] 6.68% | 170,386 | 2.8% |
[ 6.5% - 7.0% ] 7.00% | 86,456 | 2.0% |
[ 7.0% - 7.5% ] 7.24% | 166,315 | 2.0% |
[ 7.5% - 8.0% ] 7.68% | 32,177 | 2.7% |
[ 7.5% - 8.0% ] 7.91% | 128,918 | 3.0% |
[ 8.0% - 8.5% ] 8.14% | 117,803 | 2.7% |
[ 8.0% - 8.5% ] 8.37% | 123,472 | 1.6% |
[ 9.0% - 9.5% ] 9.03% | 58,717 | 1.7% |
[ 9.0% - 9.5% ] 9.41% | 5,864 | 1.7% |
[ 9.5% - 10.0% ] 9.66% | 28,230 | 3.6% |
[ 9.5% - 10.0% ] 9.94% | 79,800 | 4.1% |
[ 10.0% - 10.5% ] 10.30% | 14,649 | 2.0% |
[ 10.5% - 11.0% ] 10.62% | 640 | 3.0% |
[ 10.5% - 11.0% ] 10.89% | 8,776 | 1.3% |
[ 11.5% - 12.0% ] 11.54% | 8,178 | 0.96% |
[ 12.0% - 12.5% ] 12.30% | 21,040 | 1.3% |
[ 12.5% - 13.0% ] 12.90% | 6,951 | 1.6% |
[ 15.0% - 15.5% ] 15.02% | 10,026 | 1.6% |
[ 15.0% - 15.5% ] 15.38% | 4,407 | 2.5% |
[ 16.0% - 16.5% ] 16.14% | 112,750 | 2.6% |
[ 16.5% - 17.0% ] 16.50% | 5,587 | 1.2% |
[ 17.5% - 18.0% ] 17.80% | 57,927 | 1.6% |
[ 26.5% - 27.0% ] 26.60% | 485 | 3.6% |
[ 28.0% - 28.5% ] 28.33% | 2,718 | 2.8% |