Immigrants from Brazil 1 or more Vehicles in Household
COMPARE
Immigrants from Brazil
Select to Compare
1 or more Vehicles in Household
Immigrants from Brazil 1 or more Vehicles in Household
89.6%
1+ VEHICLES AVAILABLE
40.1/ 100
METRIC RATING
185th/ 347
METRIC RANK
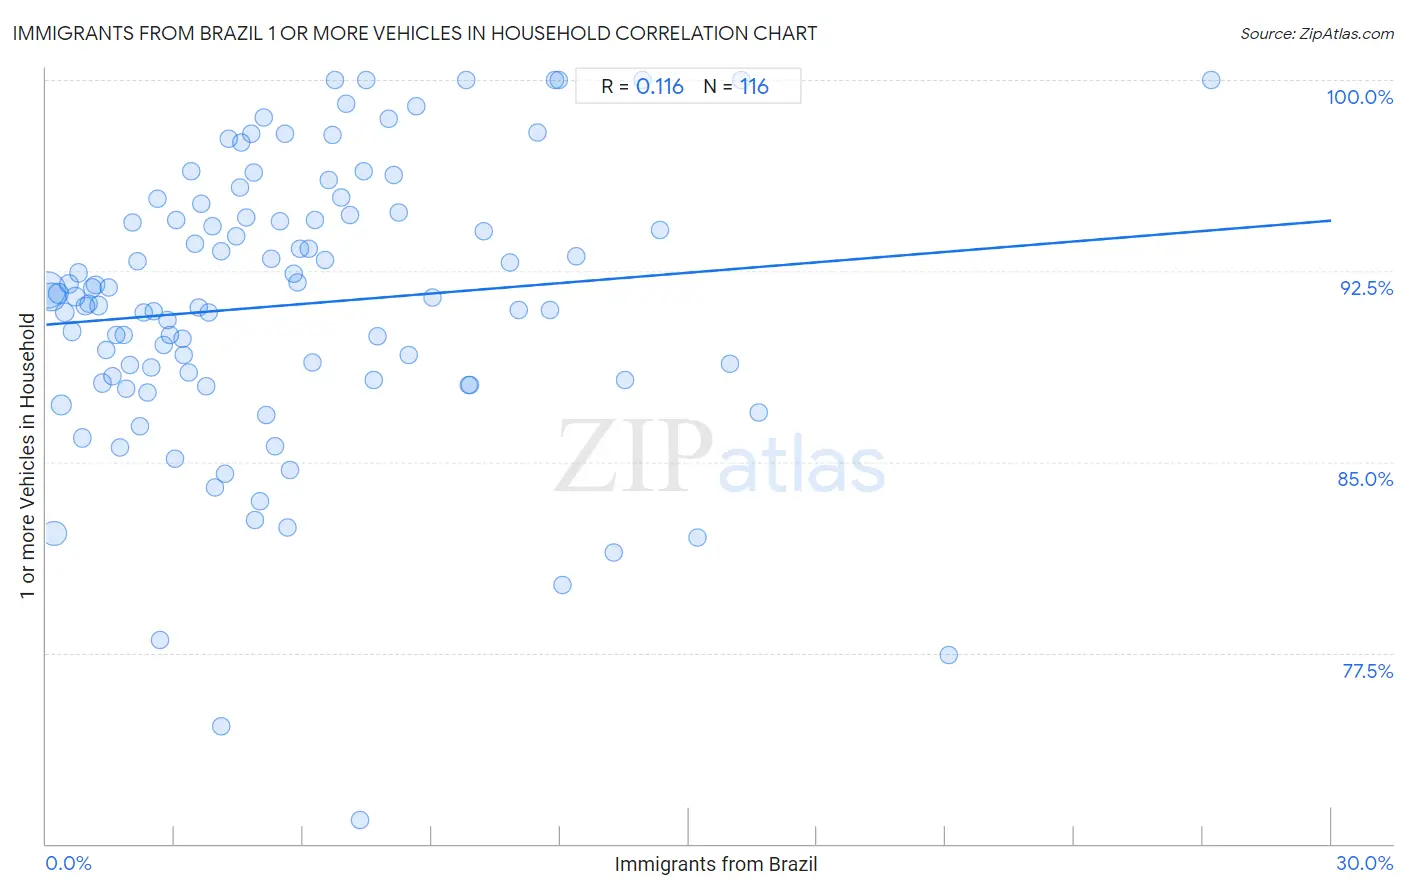
Immigrants from Brazil 1 or more Vehicles in Household Correlation Chart
The statistical analysis conducted on geographies consisting of 342,498,313 people shows a poor positive correlation between the proportion of Immigrants from Brazil and percentage of households with 1 or more vehicles available in the United States with a correlation coefficient (R) of 0.116 and weighted average of 89.6%. On average, for every 1% (one percent) increase in Immigrants from Brazil within a typical geography, there is an increase of 0.14% in percentage of households with 1 or more vehicles available.
It is essential to understand that the correlation between the percentage of Immigrants from Brazil and percentage of households with 1 or more vehicles available does not imply a direct cause-and-effect relationship. It remains uncertain whether the presence of Immigrants from Brazil influences an upward or downward trend in the level of percentage of households with 1 or more vehicles available within an area, or if Immigrants from Brazil simply ended up residing in those areas with higher or lower levels of percentage of households with 1 or more vehicles available due to other factors.
Demographics Similar to Immigrants from Brazil by 1 or more Vehicles in Household
In terms of 1 or more vehicles in household, the demographic groups most similar to Immigrants from Brazil are Pueblo (89.6%, a difference of 0.0%), Immigrants from Bulgaria (89.6%, a difference of 0.010%), South American (89.5%, a difference of 0.010%), Ethiopian (89.6%, a difference of 0.020%), and Immigrants from Nepal (89.5%, a difference of 0.020%).
| Demographics | Rating | Rank | 1 or more Vehicles in Household |
| Immigrants from El Salvador | 44.1 /100 | #178 | Average 89.6% |
| German Russians | 44.0 /100 | #179 | Average 89.6% |
| Arabs | 43.3 /100 | #180 | Average 89.6% |
| Immigrants from Ethiopia | 42.5 /100 | #181 | Average 89.6% |
| Ukrainians | 42.4 /100 | #182 | Average 89.6% |
| Ethiopians | 41.2 /100 | #183 | Average 89.6% |
| Immigrants from Bulgaria | 40.7 /100 | #184 | Average 89.6% |
| Immigrants from Brazil | 40.1 /100 | #185 | Average 89.6% |
| Pueblo | 39.9 /100 | #186 | Fair 89.6% |
| South Americans | 39.6 /100 | #187 | Fair 89.5% |
| Immigrants from Nepal | 38.9 /100 | #188 | Fair 89.5% |
| Carpatho Rusyns | 37.8 /100 | #189 | Fair 89.5% |
| Shoshone | 37.5 /100 | #190 | Fair 89.5% |
| Immigrants from Poland | 37.1 /100 | #191 | Fair 89.5% |
| Immigrants from North Macedonia | 36.5 /100 | #192 | Fair 89.5% |
Immigrants from Brazil 1 or more Vehicles in Household Correlation Summary
| Measurement | Immigrants from Brazil Data | 1 or more Vehicles in Household Data |
| Minimum | 0.039% | 70.9% |
| Maximum | 27.2% | 100.0% |
| Range | 27.1% | 29.1% |
| Mean | 5.8% | 91.2% |
| Median | 4.7% | 91.5% |
| Interquartile 25% (IQ1) | 2.3% | 88.2% |
| Interquartile 75% (IQ3) | 7.7% | 94.7% |
| Interquartile Range (IQR) | 5.4% | 6.4% |
| Standard Deviation (Sample) | 4.7% | 5.6% |
| Standard Deviation (Population) | 4.7% | 5.6% |
Correlation Details
| Immigrants from Brazil Percentile | Sample Size | 1 or more Vehicles in Household |
[ 0.0% - 0.5% ] 0.039% | 128,434,353 | 91.8% |
[ 0.0% - 0.5% ] 0.12% | 76,059,632 | 91.5% |
[ 0.0% - 0.5% ] 0.19% | 47,083,242 | 82.2% |
[ 0.0% - 0.5% ] 0.28% | 22,652,545 | 91.6% |
[ 0.0% - 0.5% ] 0.36% | 16,964,219 | 87.2% |
[ 0.0% - 0.5% ] 0.44% | 11,193,076 | 90.9% |
[ 0.5% - 1.0% ] 0.52% | 6,397,372 | 92.0% |
[ 0.5% - 1.0% ] 0.60% | 5,779,579 | 90.1% |
[ 0.5% - 1.0% ] 0.68% | 2,893,521 | 91.5% |
[ 0.5% - 1.0% ] 0.75% | 3,317,260 | 92.4% |
[ 0.5% - 1.0% ] 0.84% | 2,298,469 | 85.9% |
[ 0.5% - 1.0% ] 0.91% | 2,602,922 | 91.1% |
[ 0.5% - 1.0% ] 1.00% | 1,732,284 | 91.2% |
[ 1.0% - 1.5% ] 1.08% | 1,260,165 | 91.8% |
[ 1.0% - 1.5% ] 1.15% | 1,369,608 | 92.0% |
[ 1.0% - 1.5% ] 1.24% | 931,456 | 91.1% |
[ 1.0% - 1.5% ] 1.31% | 830,728 | 88.1% |
[ 1.0% - 1.5% ] 1.40% | 504,062 | 89.4% |
[ 1.0% - 1.5% ] 1.47% | 501,273 | 91.8% |
[ 1.5% - 2.0% ] 1.56% | 490,700 | 88.4% |
[ 1.5% - 2.0% ] 1.64% | 630,380 | 90.0% |
[ 1.5% - 2.0% ] 1.72% | 285,816 | 85.6% |
[ 1.5% - 2.0% ] 1.81% | 631,339 | 90.0% |
[ 1.5% - 2.0% ] 1.88% | 543,046 | 87.9% |
[ 1.5% - 2.0% ] 1.96% | 469,851 | 88.8% |
[ 2.0% - 2.5% ] 2.02% | 130,963 | 94.4% |
[ 2.0% - 2.5% ] 2.12% | 344,907 | 92.9% |
[ 2.0% - 2.5% ] 2.19% | 511,768 | 86.4% |
[ 2.0% - 2.5% ] 2.28% | 379,423 | 90.9% |
[ 2.0% - 2.5% ] 2.36% | 239,972 | 87.7% |
[ 2.0% - 2.5% ] 2.45% | 63,999 | 88.7% |
[ 2.5% - 3.0% ] 2.52% | 111,486 | 90.9% |
[ 2.5% - 3.0% ] 2.59% | 140,952 | 95.3% |
[ 2.5% - 3.0% ] 2.66% | 76,869 | 78.0% |
[ 2.5% - 3.0% ] 2.75% | 414,904 | 89.6% |
[ 2.5% - 3.0% ] 2.84% | 139,973 | 90.6% |
[ 2.5% - 3.0% ] 2.89% | 418,868 | 90.0% |
[ 3.0% - 3.5% ] 3.00% | 172,249 | 85.1% |
[ 3.0% - 3.5% ] 3.04% | 149,987 | 94.5% |
[ 3.0% - 3.5% ] 3.17% | 76,458 | 89.8% |
[ 3.0% - 3.5% ] 3.21% | 112,728 | 89.2% |
[ 3.0% - 3.5% ] 3.34% | 209,912 | 88.5% |
[ 3.0% - 3.5% ] 3.38% | 6,770 | 96.4% |
[ 3.0% - 3.5% ] 3.47% | 44,105 | 93.6% |
[ 3.5% - 4.0% ] 3.57% | 49,770 | 91.1% |
[ 3.5% - 4.0% ] 3.62% | 41,372 | 95.1% |
[ 3.5% - 4.0% ] 3.73% | 63,264 | 87.9% |
[ 3.5% - 4.0% ] 3.79% | 75,805 | 90.9% |
[ 3.5% - 4.0% ] 3.88% | 53,571 | 94.3% |
[ 3.5% - 4.0% ] 3.95% | 335,898 | 84.0% |
[ 4.0% - 4.5% ] 4.07% | 27,996 | 74.6% |
[ 4.0% - 4.5% ] 4.09% | 157,704 | 93.3% |
[ 4.0% - 4.5% ] 4.18% | 64,839 | 84.6% |
[ 4.0% - 4.5% ] 4.25% | 14,620 | 97.7% |
[ 4.0% - 4.5% ] 4.43% | 10,335 | 93.9% |
[ 4.5% - 5.0% ] 4.51% | 33,414 | 95.8% |
[ 4.5% - 5.0% ] 4.56% | 86,913 | 97.5% |
[ 4.5% - 5.0% ] 4.68% | 18,822 | 94.6% |
[ 4.5% - 5.0% ] 4.78% | 6,027 | 97.9% |
[ 4.5% - 5.0% ] 4.84% | 43,421 | 96.4% |
[ 4.5% - 5.0% ] 4.88% | 38,008 | 82.7% |
[ 4.5% - 5.0% ] 4.98% | 28,729 | 83.5% |
[ 5.0% - 5.5% ] 5.06% | 158 | 98.6% |
[ 5.0% - 5.5% ] 5.14% | 139,266 | 86.9% |
[ 5.0% - 5.5% ] 5.26% | 68,427 | 93.0% |
[ 5.0% - 5.5% ] 5.33% | 863 | 85.6% |
[ 5.0% - 5.5% ] 5.46% | 9,612 | 94.4% |
[ 5.5% - 6.0% ] 5.56% | 16,684 | 97.9% |
[ 5.5% - 6.0% ] 5.62% | 130,926 | 82.4% |
[ 5.5% - 6.0% ] 5.70% | 48,457 | 84.7% |
[ 5.5% - 6.0% ] 5.77% | 132,036 | 92.4% |
[ 5.5% - 6.0% ] 5.88% | 10,921 | 92.0% |
[ 5.5% - 6.0% ] 5.93% | 65,215 | 93.4% |
[ 6.0% - 6.5% ] 6.13% | 8,775 | 93.3% |
[ 6.0% - 6.5% ] 6.21% | 54,125 | 88.9% |
[ 6.0% - 6.5% ] 6.29% | 39,028 | 94.5% |
[ 6.5% - 7.0% ] 6.50% | 46,595 | 92.9% |
[ 6.5% - 7.0% ] 6.61% | 12,940 | 96.1% |
[ 6.5% - 7.0% ] 6.69% | 2,826 | 97.8% |
[ 6.5% - 7.0% ] 6.75% | 548 | 100.0% |
[ 6.5% - 7.0% ] 6.88% | 33,691 | 95.4% |
[ 6.5% - 7.0% ] 6.99% | 58,595 | 99.0% |
[ 7.0% - 7.5% ] 7.09% | 48,922 | 94.7% |
[ 7.0% - 7.5% ] 7.32% | 2,718 | 70.9% |
[ 7.0% - 7.5% ] 7.41% | 54 | 96.4% |
[ 7.0% - 7.5% ] 7.48% | 441 | 100.0% |
[ 7.5% - 8.0% ] 7.63% | 32,076 | 88.2% |
[ 7.5% - 8.0% ] 7.73% | 54,957 | 89.9% |
[ 8.0% - 8.5% ] 8.01% | 11,929 | 98.5% |
[ 8.0% - 8.5% ] 8.12% | 1,428 | 96.3% |
[ 8.0% - 8.5% ] 8.22% | 608 | 94.8% |
[ 8.0% - 8.5% ] 8.46% | 86,455 | 89.2% |
[ 8.5% - 9.0% ] 8.64% | 4,259 | 99.0% |
[ 9.0% - 9.5% ] 9.02% | 11,551 | 91.5% |
[ 9.5% - 10.0% ] 9.81% | 1,285 | 100.0% |
[ 9.5% - 10.0% ] 9.85% | 32,091 | 88.0% |
[ 9.5% - 10.0% ] 9.90% | 31,932 | 88.0% |
[ 10.0% - 10.5% ] 10.22% | 60,009 | 94.1% |
[ 10.5% - 11.0% ] 10.82% | 152,106 | 92.8% |
[ 11.0% - 11.5% ] 11.02% | 82,782 | 91.0% |
[ 11.0% - 11.5% ] 11.46% | 5,159 | 97.9% |
[ 11.5% - 12.0% ] 11.77% | 27,569 | 91.0% |
[ 11.5% - 12.0% ] 11.86% | 59 | 100.0% |
[ 11.5% - 12.0% ] 11.97% | 259 | 100.0% |
[ 12.0% - 12.5% ] 12.04% | 97,370 | 80.1% |
[ 12.0% - 12.5% ] 12.37% | 45,694 | 93.1% |
[ 13.0% - 13.5% ] 13.26% | 181 | 81.4% |
[ 13.5% - 14.0% ] 13.52% | 17,178 | 88.2% |
[ 13.5% - 14.0% ] 13.92% | 237 | 100.0% |
[ 14.0% - 14.5% ] 14.32% | 8,547 | 94.1% |
[ 15.0% - 15.5% ] 15.21% | 4,418 | 82.1% |
[ 15.5% - 16.0% ] 15.97% | 2,367 | 88.8% |
[ 16.0% - 16.5% ] 16.23% | 154 | 100.0% |
[ 16.5% - 17.0% ] 16.65% | 38,898 | 86.9% |
[ 21.0% - 21.5% ] 21.06% | 1,016 | 77.4% |
[ 27.0% - 27.5% ] 27.19% | 217 | 100.0% |