Immigrants from Brazil Married-Couple Family Poverty
COMPARE
Immigrants from Brazil
Select to Compare
Married-Couple Family Poverty
Immigrants from Brazil Married-Couple Family Poverty
5.0%
POVERTY | MARRIED-COUPLE FAMILIES
84.6/ 100
METRIC RATING
141st/ 347
METRIC RANK
Immigrants from Brazil Married-Couple Family Poverty Correlation Chart
The statistical analysis conducted on geographies consisting of 340,364,387 people shows a weak positive correlation between the proportion of Immigrants from Brazil and poverty level among married-couple families in the United States with a correlation coefficient (R) of 0.288 and weighted average of 5.0%. On average, for every 1% (one percent) increase in Immigrants from Brazil within a typical geography, there is an increase of 0.33% in poverty level among married-couple families.
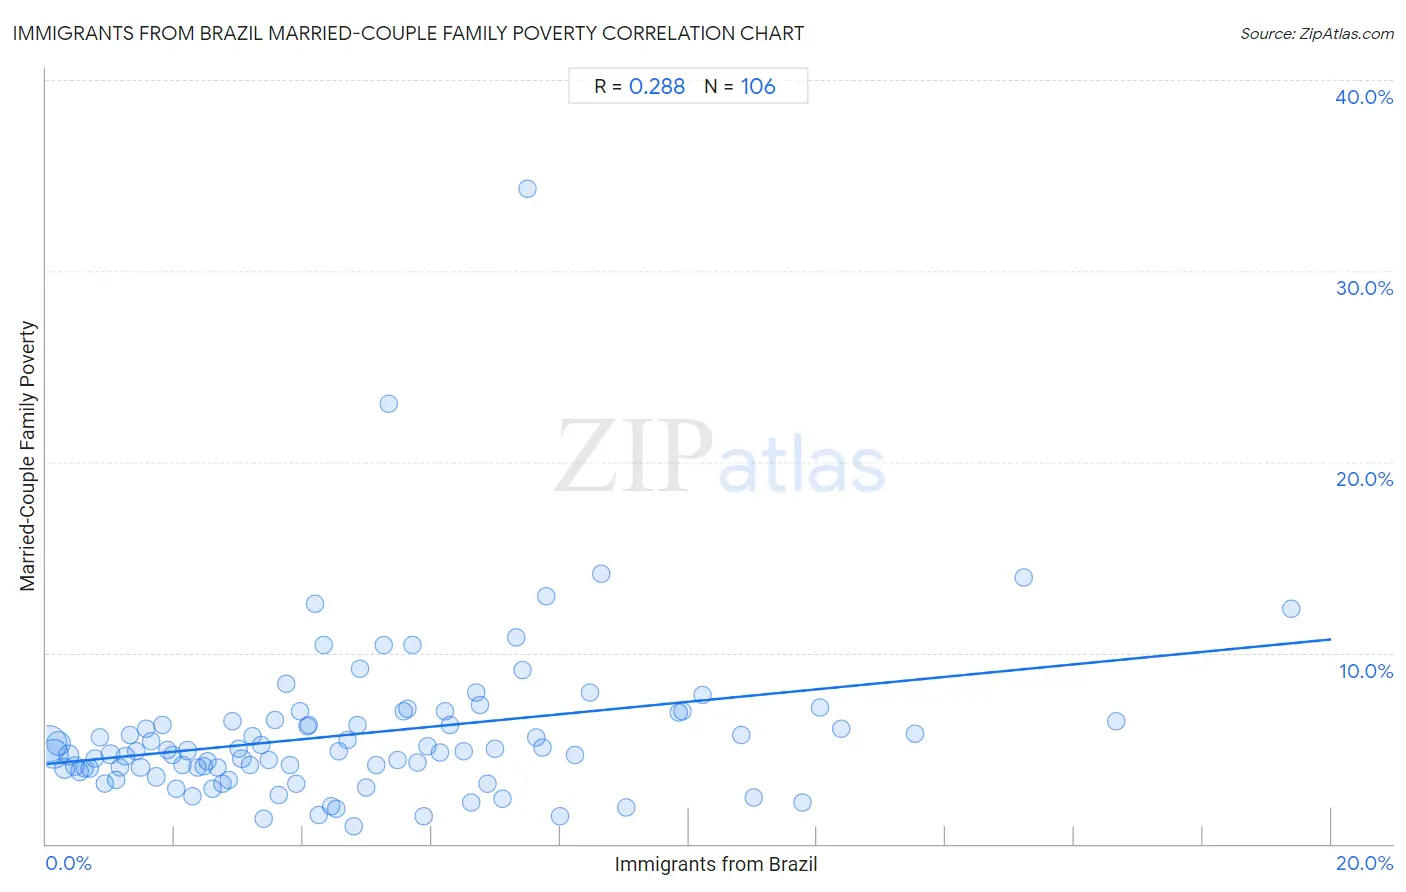
It is essential to understand that the correlation between the percentage of Immigrants from Brazil and poverty level among married-couple families does not imply a direct cause-and-effect relationship. It remains uncertain whether the presence of Immigrants from Brazil influences an upward or downward trend in the level of poverty level among married-couple families within an area, or if Immigrants from Brazil simply ended up residing in those areas with higher or lower levels of poverty level among married-couple families due to other factors.
Demographics Similar to Immigrants from Brazil by Married-Couple Family Poverty
In terms of married-couple family poverty, the demographic groups most similar to Immigrants from Brazil are Immigrants from China (5.0%, a difference of 0.0%), Immigrants from Portugal (5.0%, a difference of 0.050%), German Russian (5.0%, a difference of 0.11%), Immigrants from Egypt (5.0%, a difference of 0.27%), and Hmong (5.0%, a difference of 0.32%).
| Demographics | Rating | Rank | Married-Couple Family Poverty |
| Samoans | 90.2 /100 | #134 | Exceptional 4.9% |
| Assyrians/Chaldeans/Syriacs | 89.4 /100 | #135 | Excellent 4.9% |
| Immigrants from Hungary | 88.7 /100 | #136 | Excellent 4.9% |
| Guamanians/Chamorros | 86.5 /100 | #137 | Excellent 4.9% |
| Chileans | 86.0 /100 | #138 | Excellent 4.9% |
| German Russians | 85.1 /100 | #139 | Excellent 5.0% |
| Immigrants from Portugal | 84.8 /100 | #140 | Excellent 5.0% |
| Immigrants from Brazil | 84.6 /100 | #141 | Excellent 5.0% |
| Immigrants from China | 84.6 /100 | #142 | Excellent 5.0% |
| Immigrants from Egypt | 83.4 /100 | #143 | Excellent 5.0% |
| Hmong | 83.2 /100 | #144 | Excellent 5.0% |
| Immigrants from Spain | 79.9 /100 | #145 | Good 5.0% |
| Mongolians | 79.8 /100 | #146 | Good 5.0% |
| Syrians | 78.7 /100 | #147 | Good 5.0% |
| Immigrants from Russia | 78.7 /100 | #148 | Good 5.0% |
Immigrants from Brazil Married-Couple Family Poverty Correlation Summary
| Measurement | Immigrants from Brazil Data | Married-Couple Family Poverty Data |
| Minimum | 0.039% | 0.92% |
| Maximum | 19.4% | 34.3% |
| Range | 19.3% | 33.4% |
| Mean | 4.9% | 5.8% |
| Median | 4.2% | 4.9% |
| Interquartile 25% (IQ1) | 2.1% | 3.9% |
| Interquartile 75% (IQ3) | 6.8% | 6.4% |
| Interquartile Range (IQR) | 4.6% | 2.5% |
| Standard Deviation (Sample) | 3.7% | 4.2% |
| Standard Deviation (Population) | 3.7% | 4.2% |
Correlation Details
| Immigrants from Brazil Percentile | Sample Size | Married-Couple Family Poverty |
[ 0.0% - 0.5% ] 0.039% | 128,190,986 | 5.2% |
[ 0.0% - 0.5% ] 0.12% | 75,776,650 | 4.7% |
[ 0.0% - 0.5% ] 0.19% | 46,737,677 | 5.2% |
[ 0.0% - 0.5% ] 0.28% | 22,399,575 | 3.9% |
[ 0.0% - 0.5% ] 0.36% | 16,754,335 | 4.6% |
[ 0.0% - 0.5% ] 0.44% | 11,006,075 | 4.1% |
[ 0.5% - 1.0% ] 0.52% | 6,208,755 | 3.8% |
[ 0.5% - 1.0% ] 0.60% | 5,704,366 | 3.9% |
[ 0.5% - 1.0% ] 0.68% | 2,830,449 | 4.0% |
[ 0.5% - 1.0% ] 0.75% | 3,205,354 | 4.5% |
[ 0.5% - 1.0% ] 0.84% | 2,249,640 | 5.6% |
[ 0.5% - 1.0% ] 0.91% | 2,531,202 | 3.2% |
[ 1.0% - 1.5% ] 1.00% | 1,663,479 | 4.7% |
[ 1.0% - 1.5% ] 1.08% | 1,231,438 | 3.3% |
[ 1.0% - 1.5% ] 1.15% | 1,351,285 | 4.0% |
[ 1.0% - 1.5% ] 1.23% | 886,623 | 4.6% |
[ 1.0% - 1.5% ] 1.31% | 797,354 | 5.7% |
[ 1.0% - 1.5% ] 1.40% | 487,677 | 4.9% |
[ 1.0% - 1.5% ] 1.47% | 488,191 | 4.0% |
[ 1.5% - 2.0% ] 1.56% | 437,150 | 6.0% |
[ 1.5% - 2.0% ] 1.64% | 623,078 | 5.4% |
[ 1.5% - 2.0% ] 1.72% | 280,809 | 3.5% |
[ 1.5% - 2.0% ] 1.81% | 627,891 | 6.2% |
[ 1.5% - 2.0% ] 1.88% | 532,705 | 4.9% |
[ 1.5% - 2.0% ] 1.96% | 459,662 | 4.7% |
[ 2.0% - 2.5% ] 2.02% | 130,963 | 2.9% |
[ 2.0% - 2.5% ] 2.12% | 333,706 | 4.1% |
[ 2.0% - 2.5% ] 2.19% | 508,469 | 4.9% |
[ 2.0% - 2.5% ] 2.28% | 348,884 | 2.5% |
[ 2.0% - 2.5% ] 2.36% | 217,705 | 4.0% |
[ 2.0% - 2.5% ] 2.45% | 47,947 | 4.1% |
[ 2.5% - 3.0% ] 2.52% | 111,210 | 4.3% |
[ 2.5% - 3.0% ] 2.59% | 132,364 | 2.9% |
[ 2.5% - 3.0% ] 2.66% | 76,869 | 4.0% |
[ 2.5% - 3.0% ] 2.75% | 414,794 | 3.2% |
[ 2.5% - 3.0% ] 2.84% | 139,973 | 3.3% |
[ 2.5% - 3.0% ] 2.89% | 418,868 | 6.4% |
[ 3.0% - 3.5% ] 3.00% | 171,709 | 5.0% |
[ 3.0% - 3.5% ] 3.04% | 148,955 | 4.4% |
[ 3.0% - 3.5% ] 3.17% | 75,756 | 4.1% |
[ 3.0% - 3.5% ] 3.21% | 111,719 | 5.7% |
[ 3.0% - 3.5% ] 3.34% | 209,912 | 5.2% |
[ 3.0% - 3.5% ] 3.38% | 6,770 | 1.3% |
[ 3.0% - 3.5% ] 3.47% | 33,724 | 4.4% |
[ 3.5% - 4.0% ] 3.57% | 49,770 | 6.5% |
[ 3.5% - 4.0% ] 3.62% | 40,772 | 2.5% |
[ 3.5% - 4.0% ] 3.73% | 63,264 | 8.4% |
[ 3.5% - 4.0% ] 3.79% | 75,805 | 4.1% |
[ 3.5% - 4.0% ] 3.88% | 53,417 | 3.1% |
[ 3.5% - 4.0% ] 3.95% | 335,694 | 6.9% |
[ 4.0% - 4.5% ] 4.07% | 27,996 | 6.2% |
[ 4.0% - 4.5% ] 4.09% | 157,704 | 6.2% |
[ 4.0% - 4.5% ] 4.18% | 64,839 | 12.6% |
[ 4.0% - 4.5% ] 4.25% | 14,620 | 1.5% |
[ 4.0% - 4.5% ] 4.33% | 327,250 | 10.4% |
[ 4.0% - 4.5% ] 4.43% | 10,335 | 2.0% |
[ 4.5% - 5.0% ] 4.51% | 33,414 | 1.8% |
[ 4.5% - 5.0% ] 4.56% | 86,913 | 4.8% |
[ 4.5% - 5.0% ] 4.68% | 14,779 | 5.4% |
[ 4.5% - 5.0% ] 4.78% | 6,027 | 0.92% |
[ 4.5% - 5.0% ] 4.84% | 43,421 | 6.2% |
[ 4.5% - 5.0% ] 4.88% | 38,008 | 9.2% |
[ 4.5% - 5.0% ] 4.98% | 27,692 | 3.0% |
[ 5.0% - 5.5% ] 5.14% | 139,266 | 4.1% |
[ 5.0% - 5.5% ] 5.26% | 68,427 | 10.4% |
[ 5.0% - 5.5% ] 5.33% | 863 | 23.0% |
[ 5.0% - 5.5% ] 5.46% | 9,246 | 4.4% |
[ 5.5% - 6.0% ] 5.56% | 16,684 | 6.9% |
[ 5.5% - 6.0% ] 5.62% | 130,926 | 7.1% |
[ 5.5% - 6.0% ] 5.70% | 48,283 | 10.4% |
[ 5.5% - 6.0% ] 5.77% | 132,036 | 4.3% |
[ 5.5% - 6.0% ] 5.88% | 10,018 | 1.5% |
[ 5.5% - 6.0% ] 5.93% | 65,215 | 5.1% |
[ 6.0% - 6.5% ] 6.13% | 7,649 | 4.8% |
[ 6.0% - 6.5% ] 6.21% | 54,125 | 6.9% |
[ 6.0% - 6.5% ] 6.29% | 39,028 | 6.2% |
[ 6.5% - 7.0% ] 6.50% | 46,595 | 4.9% |
[ 6.5% - 7.0% ] 6.61% | 12,940 | 2.2% |
[ 6.5% - 7.0% ] 6.69% | 2,766 | 7.9% |
[ 6.5% - 7.0% ] 6.75% | 548 | 7.2% |
[ 6.5% - 7.0% ] 6.88% | 33,691 | 3.1% |
[ 6.5% - 7.0% ] 6.99% | 58,595 | 5.0% |
[ 7.0% - 7.5% ] 7.09% | 48,922 | 2.4% |
[ 7.0% - 7.5% ] 7.32% | 2,718 | 10.8% |
[ 7.0% - 7.5% ] 7.41% | 54 | 9.1% |
[ 7.0% - 7.5% ] 7.49% | 307 | 34.3% |
[ 7.5% - 8.0% ] 7.63% | 32,076 | 5.5% |
[ 7.5% - 8.0% ] 7.73% | 54,957 | 5.1% |
[ 7.5% - 8.0% ] 7.78% | 13,154 | 12.9% |
[ 8.0% - 8.5% ] 8.01% | 11,929 | 1.5% |
[ 8.0% - 8.5% ] 8.22% | 608 | 4.7% |
[ 8.0% - 8.5% ] 8.46% | 86,455 | 7.9% |
[ 8.5% - 9.0% ] 8.64% | 3,589 | 14.2% |
[ 9.0% - 9.5% ] 9.02% | 11,551 | 1.9% |
[ 9.5% - 10.0% ] 9.85% | 32,091 | 6.9% |
[ 9.5% - 10.0% ] 9.90% | 31,932 | 6.9% |
[ 10.0% - 10.5% ] 10.22% | 60,009 | 7.8% |
[ 10.5% - 11.0% ] 10.82% | 152,106 | 5.7% |
[ 11.0% - 11.5% ] 11.02% | 82,782 | 2.4% |
[ 11.5% - 12.0% ] 11.77% | 27,569 | 2.2% |
[ 12.0% - 12.5% ] 12.04% | 97,370 | 7.1% |
[ 12.0% - 12.5% ] 12.37% | 45,694 | 6.0% |
[ 13.5% - 14.0% ] 13.52% | 17,178 | 5.7% |
[ 15.0% - 15.5% ] 15.21% | 4,418 | 14.0% |
[ 16.5% - 17.0% ] 16.65% | 38,898 | 6.4% |
[ 19.0% - 19.5% ] 19.37% | 56,696 | 12.3% |