Immigrants from Brazil Disability Age Under 5
COMPARE
Immigrants from Brazil
Select to Compare
Disability Age Under 5
Immigrants from Brazil Disability Age Under 5
1.4%
DISABILITY | AGE UNDER 5
0.7/ 100
METRIC RATING
254th/ 347
METRIC RANK
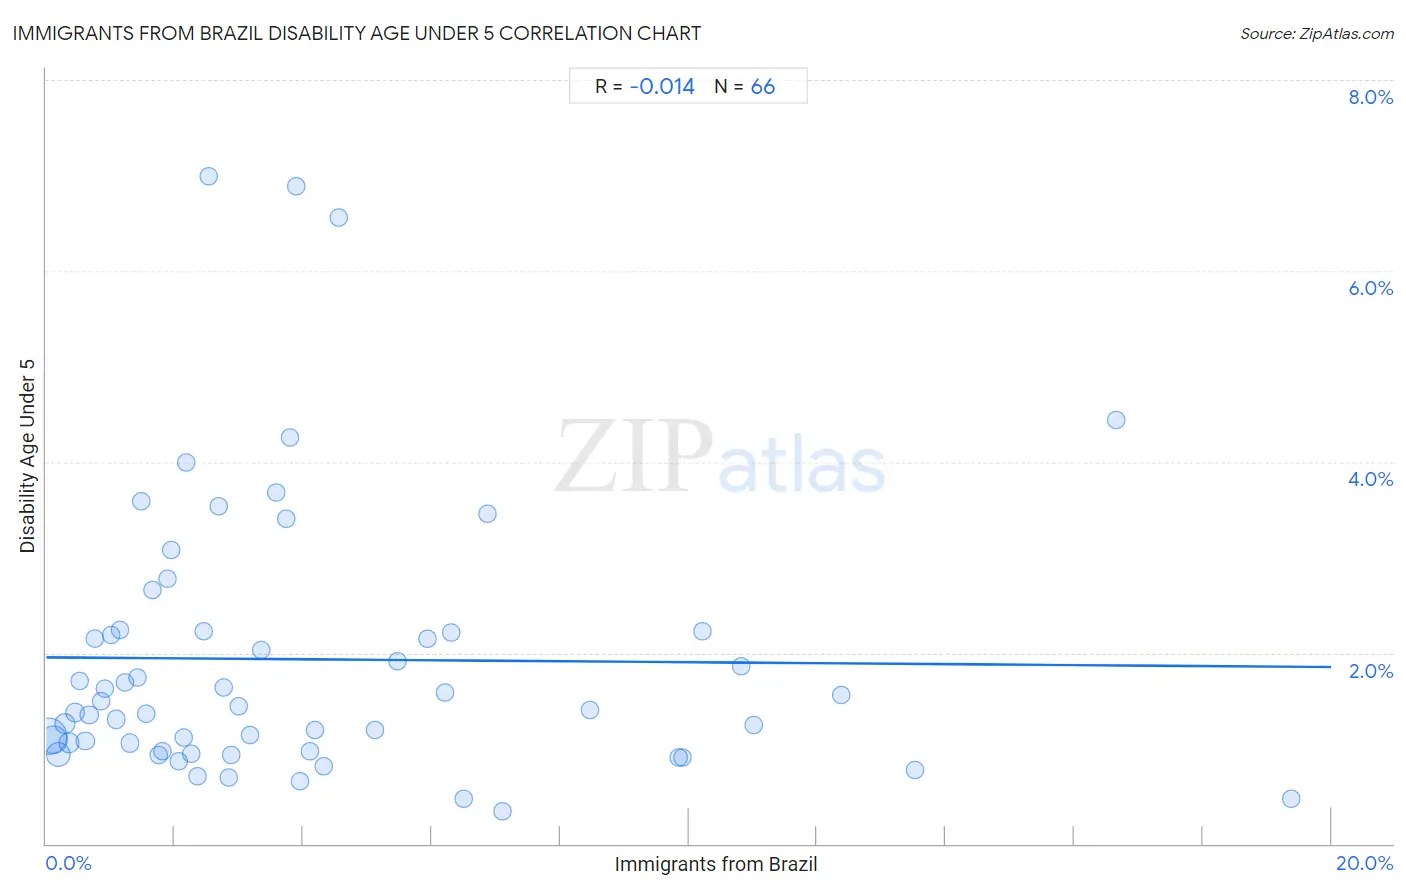
Immigrants from Brazil Disability Age Under 5 Correlation Chart
The statistical analysis conducted on geographies consisting of 192,252,216 people shows no correlation between the proportion of Immigrants from Brazil and percentage of population with a disability under the age of 5 in the United States with a correlation coefficient (R) of -0.014 and weighted average of 1.4%. On average, for every 1% (one percent) increase in Immigrants from Brazil within a typical geography, there is a decrease of 0.0051% in percentage of population with a disability under the age of 5.
It is essential to understand that the correlation between the percentage of Immigrants from Brazil and percentage of population with a disability under the age of 5 does not imply a direct cause-and-effect relationship. It remains uncertain whether the presence of Immigrants from Brazil influences an upward or downward trend in the level of percentage of population with a disability under the age of 5 within an area, or if Immigrants from Brazil simply ended up residing in those areas with higher or lower levels of percentage of population with a disability under the age of 5 due to other factors.
Demographics Similar to Immigrants from Brazil by Disability Age Under 5
In terms of disability age under 5, the demographic groups most similar to Immigrants from Brazil are Immigrants from Liberia (1.4%, a difference of 0.060%), Australian (1.4%, a difference of 0.080%), Immigrants from Western Europe (1.4%, a difference of 0.48%), Immigrants from Scotland (1.4%, a difference of 0.76%), and Immigrants from Hungary (1.4%, a difference of 0.80%).
| Demographics | Rating | Rank | Disability Age Under 5 |
| Immigrants from England | 1.0 /100 | #247 | Tragic 1.4% |
| Eastern Europeans | 1.0 /100 | #248 | Tragic 1.4% |
| Bermudans | 1.0 /100 | #249 | Tragic 1.4% |
| Africans | 1.0 /100 | #250 | Tragic 1.4% |
| Immigrants from Hungary | 1.0 /100 | #251 | Tragic 1.4% |
| Immigrants from Scotland | 0.9 /100 | #252 | Tragic 1.4% |
| Australians | 0.7 /100 | #253 | Tragic 1.4% |
| Immigrants from Brazil | 0.7 /100 | #254 | Tragic 1.4% |
| Immigrants from Liberia | 0.6 /100 | #255 | Tragic 1.4% |
| Immigrants from Western Europe | 0.5 /100 | #256 | Tragic 1.4% |
| Slovenes | 0.3 /100 | #257 | Tragic 1.4% |
| Costa Ricans | 0.3 /100 | #258 | Tragic 1.4% |
| Immigrants from Southern Europe | 0.3 /100 | #259 | Tragic 1.4% |
| Slavs | 0.3 /100 | #260 | Tragic 1.4% |
| Immigrants from Netherlands | 0.2 /100 | #261 | Tragic 1.4% |
Immigrants from Brazil Disability Age Under 5 Correlation Summary
| Measurement | Immigrants from Brazil Data | Disability Age Under 5 Data |
| Minimum | 0.038% | 0.34% |
| Maximum | 19.4% | 7.0% |
| Range | 19.3% | 6.7% |
| Mean | 4.1% | 1.9% |
| Median | 2.7% | 1.4% |
| Interquartile 25% (IQ1) | 1.3% | 0.98% |
| Interquartile 75% (IQ3) | 5.5% | 2.2% |
| Interquartile Range (IQR) | 4.2% | 1.2% |
| Standard Deviation (Sample) | 4.1% | 1.4% |
| Standard Deviation (Population) | 4.1% | 1.4% |
Correlation Details
| Immigrants from Brazil Percentile | Sample Size | Disability Age Under 5 |
[ 0.0% - 0.5% ] 0.038% | 78,272,895 | 1.1% |
[ 0.0% - 0.5% ] 0.12% | 43,695,779 | 1.1% |
[ 0.0% - 0.5% ] 0.19% | 30,365,612 | 0.94% |
[ 0.0% - 0.5% ] 0.29% | 11,105,434 | 1.3% |
[ 0.0% - 0.5% ] 0.35% | 8,291,239 | 1.1% |
[ 0.0% - 0.5% ] 0.44% | 4,630,750 | 1.4% |
[ 0.5% - 1.0% ] 0.52% | 2,569,687 | 1.7% |
[ 0.5% - 1.0% ] 0.61% | 2,438,883 | 1.1% |
[ 0.5% - 1.0% ] 0.67% | 768,750 | 1.3% |
[ 0.5% - 1.0% ] 0.75% | 1,420,988 | 2.1% |
[ 0.5% - 1.0% ] 0.85% | 909,299 | 1.5% |
[ 0.5% - 1.0% ] 0.92% | 1,070,104 | 1.6% |
[ 1.0% - 1.5% ] 1.01% | 336,805 | 2.2% |
[ 1.0% - 1.5% ] 1.09% | 427,417 | 1.3% |
[ 1.0% - 1.5% ] 1.14% | 338,062 | 2.2% |
[ 1.0% - 1.5% ] 1.23% | 436,076 | 1.7% |
[ 1.0% - 1.5% ] 1.31% | 479,086 | 1.1% |
[ 1.0% - 1.5% ] 1.41% | 158,751 | 1.7% |
[ 1.0% - 1.5% ] 1.48% | 155,060 | 3.6% |
[ 1.5% - 2.0% ] 1.56% | 271,210 | 1.4% |
[ 1.5% - 2.0% ] 1.65% | 257,870 | 2.7% |
[ 1.5% - 2.0% ] 1.75% | 40,198 | 0.92% |
[ 1.5% - 2.0% ] 1.81% | 422,845 | 0.97% |
[ 1.5% - 2.0% ] 1.89% | 87,366 | 2.8% |
[ 1.5% - 2.0% ] 1.94% | 91,776 | 3.1% |
[ 2.0% - 2.5% ] 2.07% | 9,867 | 0.86% |
[ 2.0% - 2.5% ] 2.14% | 113,855 | 1.1% |
[ 2.0% - 2.5% ] 2.19% | 196,311 | 4.0% |
[ 2.0% - 2.5% ] 2.25% | 24,444 | 0.94% |
[ 2.0% - 2.5% ] 2.36% | 29,215 | 0.71% |
[ 2.0% - 2.5% ] 2.46% | 16,151 | 2.2% |
[ 2.5% - 3.0% ] 2.52% | 24,805 | 7.0% |
[ 2.5% - 3.0% ] 2.68% | 32,323 | 3.5% |
[ 2.5% - 3.0% ] 2.77% | 229,166 | 1.6% |
[ 2.5% - 3.0% ] 2.84% | 133,308 | 0.70% |
[ 2.5% - 3.0% ] 2.88% | 311,236 | 0.93% |
[ 3.0% - 3.5% ] 3.00% | 145,327 | 1.4% |
[ 3.0% - 3.5% ] 3.17% | 69,726 | 1.1% |
[ 3.0% - 3.5% ] 3.35% | 93,638 | 2.0% |
[ 3.5% - 4.0% ] 3.57% | 6,661 | 3.7% |
[ 3.5% - 4.0% ] 3.73% | 40,724 | 3.4% |
[ 3.5% - 4.0% ] 3.80% | 46,754 | 4.3% |
[ 3.5% - 4.0% ] 3.89% | 18,923 | 6.9% |
[ 3.5% - 4.0% ] 3.94% | 269,639 | 0.65% |
[ 4.0% - 4.5% ] 4.10% | 111,790 | 0.98% |
[ 4.0% - 4.5% ] 4.18% | 64,839 | 1.2% |
[ 4.0% - 4.5% ] 4.32% | 307,355 | 0.82% |
[ 4.5% - 5.0% ] 4.55% | 15,496 | 6.6% |
[ 5.0% - 5.5% ] 5.12% | 36,546 | 1.2% |
[ 5.0% - 5.5% ] 5.46% | 9,246 | 1.9% |
[ 5.5% - 6.0% ] 5.93% | 65,215 | 2.1% |
[ 6.0% - 6.5% ] 6.21% | 54,125 | 1.6% |
[ 6.0% - 6.5% ] 6.29% | 30,951 | 2.2% |
[ 6.5% - 7.0% ] 6.50% | 46,595 | 0.47% |
[ 6.5% - 7.0% ] 6.88% | 33,691 | 3.5% |
[ 7.0% - 7.5% ] 7.09% | 48,922 | 0.34% |
[ 8.0% - 8.5% ] 8.46% | 86,455 | 1.4% |
[ 9.5% - 10.0% ] 9.85% | 32,091 | 0.90% |
[ 9.5% - 10.0% ] 9.90% | 31,932 | 0.90% |
[ 10.0% - 10.5% ] 10.22% | 60,009 | 2.2% |
[ 10.5% - 11.0% ] 10.82% | 121,695 | 1.9% |
[ 11.0% - 11.5% ] 11.02% | 82,782 | 1.2% |
[ 12.0% - 12.5% ] 12.37% | 45,694 | 1.6% |
[ 13.5% - 14.0% ] 13.52% | 17,178 | 0.77% |
[ 16.5% - 17.0% ] 16.65% | 38,898 | 4.4% |
[ 19.0% - 19.5% ] 19.37% | 56,696 | 0.48% |