Immigrants from Brazil 3 or more Vehicles in Household
COMPARE
Immigrants from Brazil
Select to Compare
3 or more Vehicles in Household
Immigrants from Brazil 3 or more Vehicles in Household
17.1%
3+ VEHICLES AVAILABLE
0.2/ 100
METRIC RATING
287th/ 347
METRIC RANK
Immigrants from Brazil 3 or more Vehicles in Household Correlation Chart
The statistical analysis conducted on geographies consisting of 342,747,996 people shows a poor positive correlation between the proportion of Immigrants from Brazil and percentage of households with 3 or more vehicles available in the United States with a correlation coefficient (R) of 0.102 and weighted average of 17.1%. On average, for every 1% (one percent) increase in Immigrants from Brazil within a typical geography, there is an increase of 0.17% in percentage of households with 3 or more vehicles available.
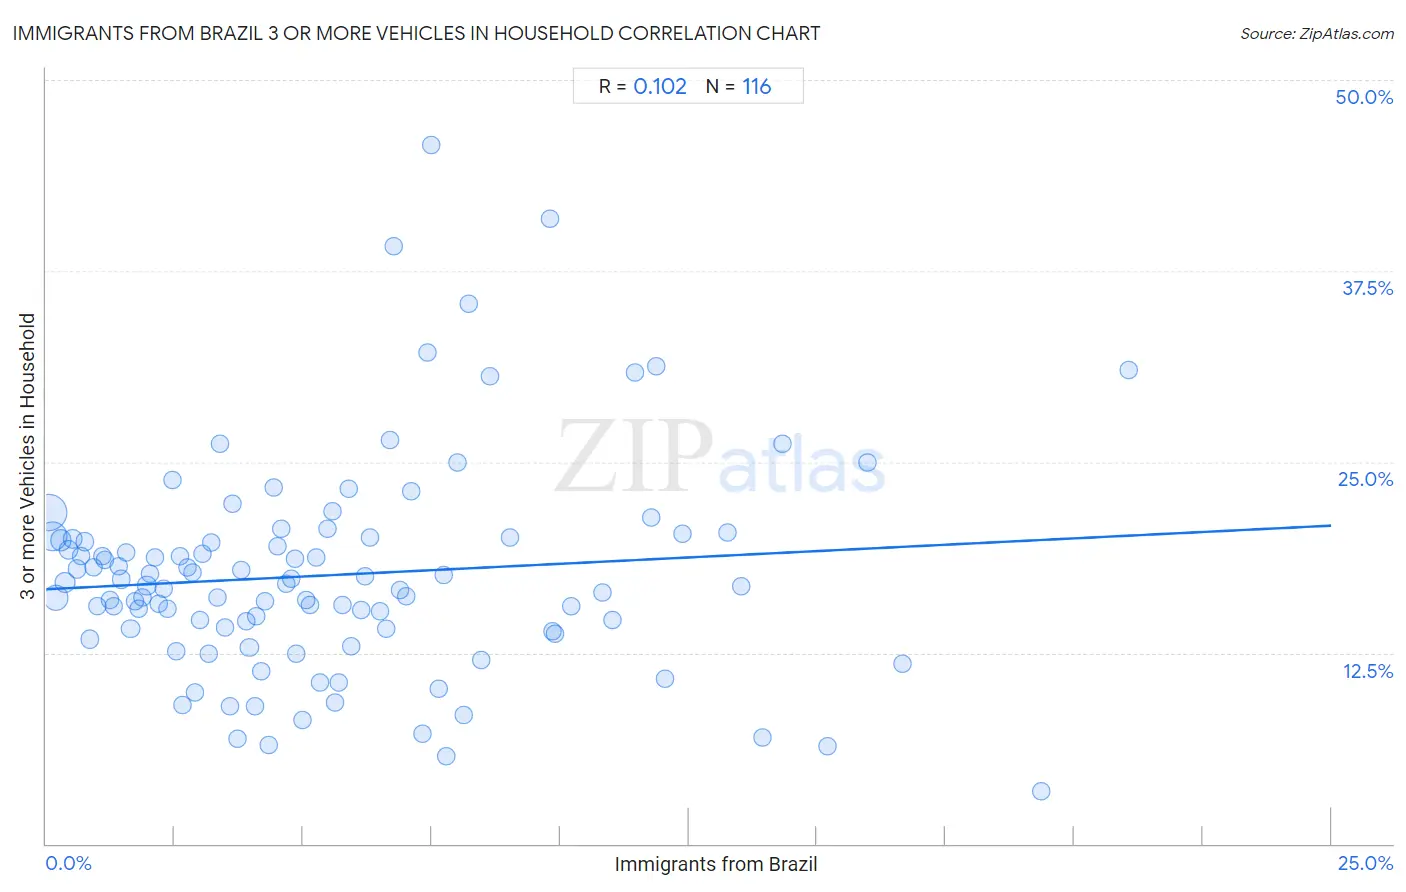
It is essential to understand that the correlation between the percentage of Immigrants from Brazil and percentage of households with 3 or more vehicles available does not imply a direct cause-and-effect relationship. It remains uncertain whether the presence of Immigrants from Brazil influences an upward or downward trend in the level of percentage of households with 3 or more vehicles available within an area, or if Immigrants from Brazil simply ended up residing in those areas with higher or lower levels of percentage of households with 3 or more vehicles available due to other factors.
Demographics Similar to Immigrants from Brazil by 3 or more Vehicles in Household
In terms of 3 or more vehicles in household, the demographic groups most similar to Immigrants from Brazil are Immigrants from Uruguay (17.1%, a difference of 0.090%), Immigrants from Liberia (17.1%, a difference of 0.16%), Menominee (17.2%, a difference of 0.30%), Immigrants from Croatia (17.2%, a difference of 0.36%), and Liberian (17.0%, a difference of 0.73%).
| Demographics | Rating | Rank | 3 or more Vehicles in Household |
| Immigrants from Eastern Europe | 0.3 /100 | #280 | Tragic 17.4% |
| Immigrants from Latvia | 0.3 /100 | #281 | Tragic 17.4% |
| Immigrants from Ireland | 0.3 /100 | #282 | Tragic 17.3% |
| Blacks/African Americans | 0.3 /100 | #283 | Tragic 17.3% |
| Immigrants from Colombia | 0.3 /100 | #284 | Tragic 17.3% |
| Immigrants from Croatia | 0.2 /100 | #285 | Tragic 17.2% |
| Menominee | 0.2 /100 | #286 | Tragic 17.2% |
| Immigrants from Brazil | 0.2 /100 | #287 | Tragic 17.1% |
| Immigrants from Uruguay | 0.2 /100 | #288 | Tragic 17.1% |
| Immigrants from Liberia | 0.1 /100 | #289 | Tragic 17.1% |
| Liberians | 0.1 /100 | #290 | Tragic 17.0% |
| Immigrants from Congo | 0.1 /100 | #291 | Tragic 17.0% |
| Immigrants from Spain | 0.1 /100 | #292 | Tragic 17.0% |
| Bahamians | 0.1 /100 | #293 | Tragic 16.9% |
| Immigrants from Western Africa | 0.1 /100 | #294 | Tragic 16.9% |
Immigrants from Brazil 3 or more Vehicles in Household Correlation Summary
| Measurement | Immigrants from Brazil Data | 3 or more Vehicles in Household Data |
| Minimum | 0.039% | 3.4% |
| Maximum | 21.1% | 45.7% |
| Range | 21.0% | 42.3% |
| Mean | 5.6% | 17.6% |
| Median | 4.6% | 16.9% |
| Interquartile 25% (IQ1) | 2.3% | 14.0% |
| Interquartile 75% (IQ3) | 7.6% | 20.0% |
| Interquartile Range (IQR) | 5.2% | 6.0% |
| Standard Deviation (Sample) | 4.3% | 7.1% |
| Standard Deviation (Population) | 4.3% | 7.0% |
Correlation Details
| Immigrants from Brazil Percentile | Sample Size | 3 or more Vehicles in Household |
[ 0.0% - 0.5% ] 0.039% | 128,427,370 | 21.7% |
[ 0.0% - 0.5% ] 0.12% | 76,057,386 | 20.1% |
[ 0.0% - 0.5% ] 0.19% | 47,067,729 | 16.1% |
[ 0.0% - 0.5% ] 0.28% | 22,652,545 | 19.9% |
[ 0.0% - 0.5% ] 0.36% | 16,939,190 | 17.1% |
[ 0.0% - 0.5% ] 0.44% | 11,172,674 | 19.2% |
[ 0.5% - 1.0% ] 0.52% | 6,397,372 | 20.0% |
[ 0.5% - 1.0% ] 0.60% | 5,779,579 | 18.0% |
[ 0.5% - 1.0% ] 0.68% | 2,880,942 | 18.9% |
[ 0.5% - 1.0% ] 0.75% | 3,302,122 | 19.8% |
[ 0.5% - 1.0% ] 0.84% | 2,291,990 | 13.4% |
[ 0.5% - 1.0% ] 0.91% | 2,602,038 | 18.1% |
[ 0.5% - 1.0% ] 1.00% | 1,731,063 | 15.6% |
[ 1.0% - 1.5% ] 1.08% | 1,259,697 | 18.8% |
[ 1.0% - 1.5% ] 1.15% | 1,363,338 | 18.6% |
[ 1.0% - 1.5% ] 1.24% | 931,456 | 15.9% |
[ 1.0% - 1.5% ] 1.31% | 830,728 | 15.6% |
[ 1.0% - 1.5% ] 1.40% | 499,077 | 18.2% |
[ 1.0% - 1.5% ] 1.47% | 501,273 | 17.3% |
[ 1.5% - 2.0% ] 1.56% | 488,611 | 19.1% |
[ 1.5% - 2.0% ] 1.64% | 630,380 | 14.1% |
[ 1.5% - 2.0% ] 1.72% | 283,822 | 15.9% |
[ 1.5% - 2.0% ] 1.81% | 631,339 | 15.4% |
[ 1.5% - 2.0% ] 1.88% | 543,046 | 16.1% |
[ 1.5% - 2.0% ] 1.96% | 469,851 | 16.9% |
[ 2.0% - 2.5% ] 2.02% | 130,963 | 17.7% |
[ 2.0% - 2.5% ] 2.12% | 344,907 | 18.8% |
[ 2.0% - 2.5% ] 2.19% | 511,768 | 15.7% |
[ 2.0% - 2.5% ] 2.27% | 363,025 | 16.7% |
[ 2.0% - 2.5% ] 2.36% | 239,972 | 15.4% |
[ 2.0% - 2.5% ] 2.45% | 57,549 | 23.8% |
[ 2.5% - 3.0% ] 2.52% | 111,486 | 12.6% |
[ 2.5% - 3.0% ] 2.59% | 140,952 | 18.8% |
[ 2.5% - 3.0% ] 2.66% | 76,869 | 9.1% |
[ 2.5% - 3.0% ] 2.75% | 414,904 | 18.1% |
[ 2.5% - 3.0% ] 2.84% | 139,973 | 17.8% |
[ 2.5% - 3.0% ] 2.89% | 418,868 | 9.9% |
[ 3.0% - 3.5% ] 3.00% | 172,249 | 14.6% |
[ 3.0% - 3.5% ] 3.04% | 149,987 | 19.0% |
[ 3.0% - 3.5% ] 3.17% | 76,458 | 12.4% |
[ 3.0% - 3.5% ] 3.21% | 111,719 | 19.7% |
[ 3.0% - 3.5% ] 3.34% | 209,912 | 16.1% |
[ 3.0% - 3.5% ] 3.38% | 6,770 | 26.2% |
[ 3.0% - 3.5% ] 3.47% | 44,105 | 14.1% |
[ 3.5% - 4.0% ] 3.57% | 49,770 | 9.0% |
[ 3.5% - 4.0% ] 3.62% | 41,372 | 22.3% |
[ 3.5% - 4.0% ] 3.73% | 63,264 | 6.9% |
[ 3.5% - 4.0% ] 3.79% | 75,805 | 17.9% |
[ 3.5% - 4.0% ] 3.88% | 53,571 | 14.6% |
[ 3.5% - 4.0% ] 3.95% | 335,898 | 12.9% |
[ 4.0% - 4.5% ] 4.07% | 27,996 | 9.0% |
[ 4.0% - 4.5% ] 4.09% | 157,704 | 14.9% |
[ 4.0% - 4.5% ] 4.18% | 64,839 | 11.3% |
[ 4.0% - 4.5% ] 4.25% | 14,620 | 15.9% |
[ 4.0% - 4.5% ] 4.33% | 327,503 | 6.4% |
[ 4.0% - 4.5% ] 4.43% | 10,335 | 23.3% |
[ 4.5% - 5.0% ] 4.51% | 33,414 | 19.5% |
[ 4.5% - 5.0% ] 4.56% | 86,913 | 20.6% |
[ 4.5% - 5.0% ] 4.68% | 18,822 | 17.0% |
[ 4.5% - 5.0% ] 4.78% | 6,027 | 17.3% |
[ 4.5% - 5.0% ] 4.84% | 43,421 | 18.6% |
[ 4.5% - 5.0% ] 4.88% | 38,008 | 12.4% |
[ 4.5% - 5.0% ] 4.98% | 28,729 | 8.1% |
[ 5.0% - 5.5% ] 5.06% | 158 | 15.9% |
[ 5.0% - 5.5% ] 5.14% | 139,266 | 15.6% |
[ 5.0% - 5.5% ] 5.26% | 68,427 | 18.8% |
[ 5.0% - 5.5% ] 5.33% | 863 | 10.5% |
[ 5.0% - 5.5% ] 5.46% | 9,612 | 20.7% |
[ 5.5% - 6.0% ] 5.56% | 16,684 | 21.8% |
[ 5.5% - 6.0% ] 5.62% | 130,926 | 9.2% |
[ 5.5% - 6.0% ] 5.70% | 48,457 | 10.5% |
[ 5.5% - 6.0% ] 5.77% | 132,036 | 15.6% |
[ 5.5% - 6.0% ] 5.88% | 10,018 | 23.2% |
[ 5.5% - 6.0% ] 5.93% | 65,215 | 12.9% |
[ 6.0% - 6.5% ] 6.13% | 8,775 | 15.3% |
[ 6.0% - 6.5% ] 6.21% | 54,125 | 17.5% |
[ 6.0% - 6.5% ] 6.29% | 39,028 | 20.1% |
[ 6.5% - 7.0% ] 6.50% | 46,595 | 15.2% |
[ 6.5% - 7.0% ] 6.61% | 12,940 | 14.1% |
[ 6.5% - 7.0% ] 6.69% | 2,826 | 26.4% |
[ 6.5% - 7.0% ] 6.75% | 548 | 39.1% |
[ 6.5% - 7.0% ] 6.88% | 33,691 | 16.7% |
[ 6.5% - 7.0% ] 6.99% | 58,595 | 16.2% |
[ 7.0% - 7.5% ] 7.09% | 48,922 | 23.1% |
[ 7.0% - 7.5% ] 7.32% | 2,718 | 7.2% |
[ 7.0% - 7.5% ] 7.41% | 54 | 32.1% |
[ 7.0% - 7.5% ] 7.48% | 441 | 45.7% |
[ 7.5% - 8.0% ] 7.63% | 32,076 | 10.1% |
[ 7.5% - 8.0% ] 7.73% | 54,957 | 17.6% |
[ 7.5% - 8.0% ] 7.78% | 13,154 | 5.8% |
[ 8.0% - 8.5% ] 8.01% | 11,929 | 25.0% |
[ 8.0% - 8.5% ] 8.12% | 1,428 | 8.4% |
[ 8.0% - 8.5% ] 8.22% | 608 | 35.3% |
[ 8.0% - 8.5% ] 8.46% | 86,455 | 12.0% |
[ 8.5% - 9.0% ] 8.64% | 4,259 | 30.6% |
[ 9.0% - 9.5% ] 9.02% | 11,551 | 20.0% |
[ 9.5% - 10.0% ] 9.81% | 1,285 | 40.9% |
[ 9.5% - 10.0% ] 9.85% | 32,091 | 13.9% |
[ 9.5% - 10.0% ] 9.90% | 31,932 | 13.8% |
[ 10.0% - 10.5% ] 10.22% | 60,009 | 15.6% |
[ 10.5% - 11.0% ] 10.82% | 152,106 | 16.4% |
[ 11.0% - 11.5% ] 11.02% | 82,782 | 14.6% |
[ 11.0% - 11.5% ] 11.46% | 5,159 | 30.8% |
[ 11.5% - 12.0% ] 11.77% | 27,569 | 21.3% |
[ 11.5% - 12.0% ] 11.86% | 59 | 31.2% |
[ 12.0% - 12.5% ] 12.04% | 97,370 | 10.8% |
[ 12.0% - 12.5% ] 12.37% | 45,694 | 20.3% |
[ 13.0% - 13.5% ] 13.26% | 181 | 20.4% |
[ 13.5% - 14.0% ] 13.52% | 17,178 | 16.8% |
[ 13.5% - 14.0% ] 13.92% | 237 | 6.9% |
[ 14.0% - 14.5% ] 14.32% | 8,547 | 26.2% |
[ 15.0% - 15.5% ] 15.21% | 4,418 | 6.4% |
[ 15.5% - 16.0% ] 15.97% | 2,367 | 25.0% |
[ 16.5% - 17.0% ] 16.65% | 38,898 | 11.8% |
[ 19.0% - 19.5% ] 19.37% | 56,696 | 3.4% |
[ 21.0% - 21.5% ] 21.06% | 1,016 | 31.0% |