Immigrants from Brazil Married-couple Households
COMPARE
Immigrants from Brazil
Select to Compare
Married-couple Households
Immigrants from Brazil Married-couple Households
46.2%
MARRIED-COUPLE HOUSEHOLDS
38.3/ 100
METRIC RATING
183rd/ 347
METRIC RANK
Immigrants from Brazil Married-couple Households Correlation Chart
The statistical analysis conducted on geographies consisting of 342,850,397 people shows a weak negative correlation between the proportion of Immigrants from Brazil and percentage of married-couple family households in the United States with a correlation coefficient (R) of -0.204 and weighted average of 46.2%. On average, for every 1% (one percent) increase in Immigrants from Brazil within a typical geography, there is a decrease of 0.44% in percentage of married-couple family households.
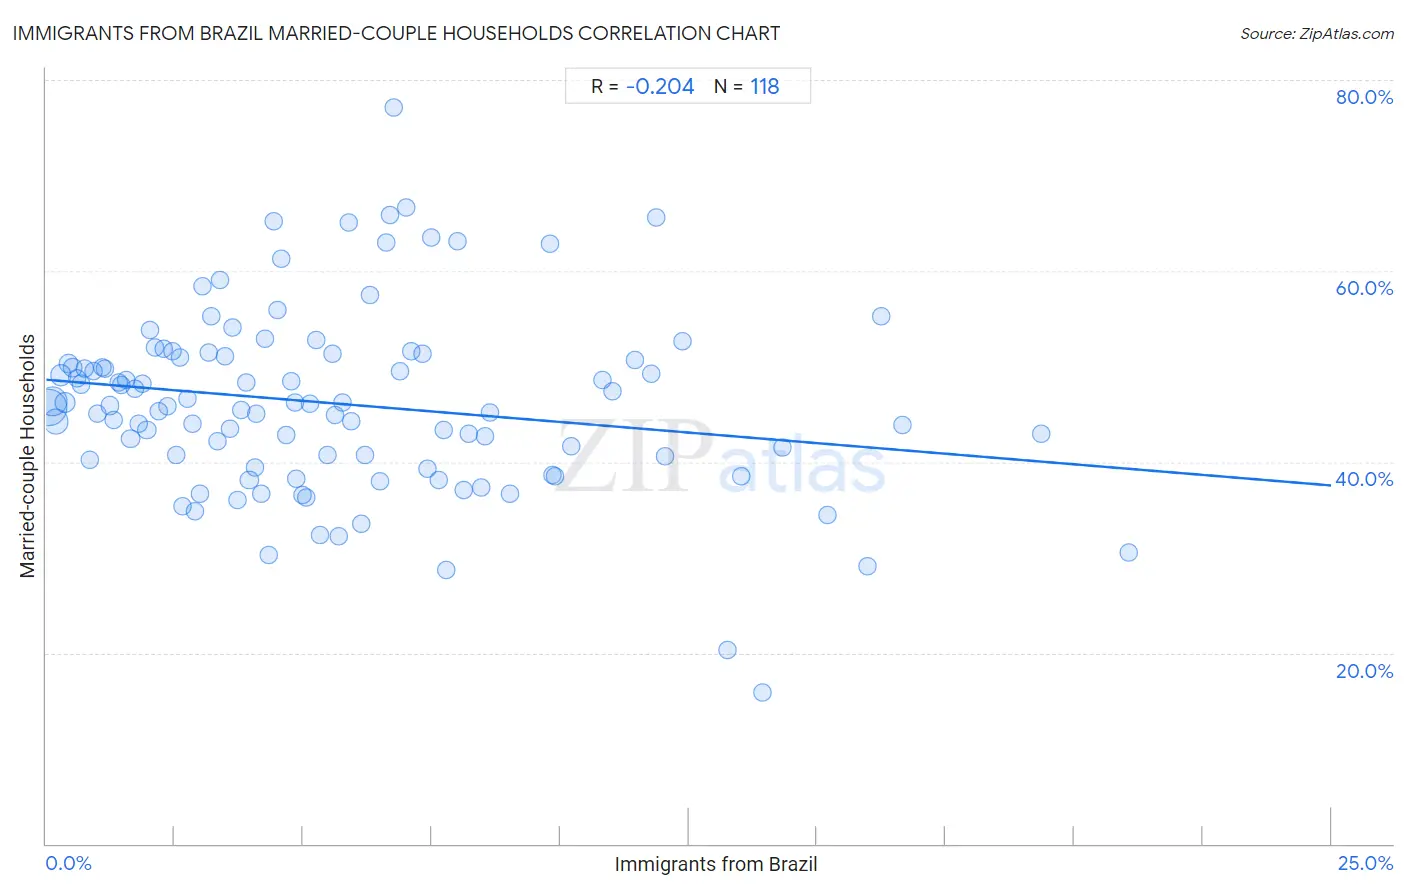
It is essential to understand that the correlation between the percentage of Immigrants from Brazil and percentage of married-couple family households does not imply a direct cause-and-effect relationship. It remains uncertain whether the presence of Immigrants from Brazil influences an upward or downward trend in the level of percentage of married-couple family households within an area, or if Immigrants from Brazil simply ended up residing in those areas with higher or lower levels of percentage of married-couple family households due to other factors.
Demographics Similar to Immigrants from Brazil by Married-couple Households
In terms of married-couple households, the demographic groups most similar to Immigrants from Brazil are Yugoslavian (46.2%, a difference of 0.020%), Immigrants from Switzerland (46.2%, a difference of 0.060%), Brazilian (46.2%, a difference of 0.10%), Malaysian (46.3%, a difference of 0.14%), and Mongolian (46.3%, a difference of 0.15%).
| Demographics | Rating | Rank | Married-couple Households |
| Cajuns | 45.2 /100 | #176 | Average 46.4% |
| Immigrants | 43.8 /100 | #177 | Average 46.3% |
| Immigrants from Costa Rica | 43.4 /100 | #178 | Average 46.3% |
| Immigrants from Zimbabwe | 43.0 /100 | #179 | Average 46.3% |
| Mongolians | 42.0 /100 | #180 | Average 46.3% |
| Malaysians | 41.8 /100 | #181 | Average 46.3% |
| Yugoslavians | 38.9 /100 | #182 | Fair 46.2% |
| Immigrants from Brazil | 38.3 /100 | #183 | Fair 46.2% |
| Immigrants from Switzerland | 36.9 /100 | #184 | Fair 46.2% |
| Brazilians | 35.9 /100 | #185 | Fair 46.2% |
| Albanians | 31.1 /100 | #186 | Fair 46.1% |
| Fijians | 29.2 /100 | #187 | Fair 46.1% |
| South American Indians | 28.4 /100 | #188 | Fair 46.0% |
| Immigrants from Latvia | 26.9 /100 | #189 | Fair 46.0% |
| Immigrants from Kuwait | 25.6 /100 | #190 | Fair 46.0% |
Immigrants from Brazil Married-couple Households Correlation Summary
| Measurement | Immigrants from Brazil Data | Married-couple Households Data |
| Minimum | 0.039% | 15.8% |
| Maximum | 21.1% | 77.1% |
| Range | 21.0% | 61.3% |
| Mean | 5.7% | 46.1% |
| Median | 4.7% | 45.9% |
| Interquartile 25% (IQ1) | 2.4% | 40.2% |
| Interquartile 75% (IQ3) | 7.7% | 51.0% |
| Interquartile Range (IQR) | 5.4% | 10.8% |
| Standard Deviation (Sample) | 4.4% | 9.6% |
| Standard Deviation (Population) | 4.4% | 9.6% |
Correlation Details
| Immigrants from Brazil Percentile | Sample Size | Married-couple Households |
[ 0.0% - 0.5% ] 0.039% | 128,434,353 | 45.6% |
[ 0.0% - 0.5% ] 0.12% | 76,057,578 | 46.3% |
[ 0.0% - 0.5% ] 0.19% | 47,067,729 | 44.3% |
[ 0.0% - 0.5% ] 0.28% | 22,647,622 | 49.0% |
[ 0.0% - 0.5% ] 0.36% | 16,954,147 | 46.3% |
[ 0.0% - 0.5% ] 0.44% | 11,193,076 | 50.3% |
[ 0.5% - 1.0% ] 0.52% | 6,397,372 | 49.9% |
[ 0.5% - 1.0% ] 0.60% | 5,779,579 | 48.7% |
[ 0.5% - 1.0% ] 0.68% | 2,893,521 | 48.1% |
[ 0.5% - 1.0% ] 0.75% | 3,317,260 | 49.7% |
[ 0.5% - 1.0% ] 0.84% | 2,291,990 | 40.2% |
[ 0.5% - 1.0% ] 0.91% | 2,602,038 | 49.5% |
[ 0.5% - 1.0% ] 1.00% | 1,732,284 | 45.1% |
[ 1.0% - 1.5% ] 1.08% | 1,260,165 | 49.9% |
[ 1.0% - 1.5% ] 1.15% | 1,369,608 | 49.8% |
[ 1.0% - 1.5% ] 1.24% | 931,456 | 45.9% |
[ 1.0% - 1.5% ] 1.31% | 830,728 | 44.4% |
[ 1.0% - 1.5% ] 1.40% | 499,077 | 48.4% |
[ 1.0% - 1.5% ] 1.47% | 501,273 | 48.1% |
[ 1.5% - 2.0% ] 1.56% | 490,700 | 48.6% |
[ 1.5% - 2.0% ] 1.64% | 630,380 | 42.5% |
[ 1.5% - 2.0% ] 1.72% | 285,816 | 47.6% |
[ 1.5% - 2.0% ] 1.81% | 631,339 | 44.0% |
[ 1.5% - 2.0% ] 1.88% | 543,046 | 48.2% |
[ 1.5% - 2.0% ] 1.96% | 469,851 | 43.3% |
[ 2.0% - 2.5% ] 2.02% | 130,963 | 53.8% |
[ 2.0% - 2.5% ] 2.12% | 344,907 | 52.0% |
[ 2.0% - 2.5% ] 2.19% | 511,768 | 45.3% |
[ 2.0% - 2.5% ] 2.28% | 379,423 | 51.9% |
[ 2.0% - 2.5% ] 2.36% | 239,972 | 45.8% |
[ 2.0% - 2.5% ] 2.45% | 63,999 | 51.6% |
[ 2.5% - 3.0% ] 2.52% | 111,486 | 40.7% |
[ 2.5% - 3.0% ] 2.59% | 140,952 | 50.9% |
[ 2.5% - 3.0% ] 2.66% | 76,869 | 35.4% |
[ 2.5% - 3.0% ] 2.75% | 414,904 | 46.6% |
[ 2.5% - 3.0% ] 2.84% | 139,973 | 44.1% |
[ 2.5% - 3.0% ] 2.89% | 418,868 | 34.8% |
[ 3.0% - 3.5% ] 3.00% | 172,249 | 36.6% |
[ 3.0% - 3.5% ] 3.04% | 149,987 | 58.4% |
[ 3.0% - 3.5% ] 3.17% | 76,458 | 51.5% |
[ 3.0% - 3.5% ] 3.21% | 112,728 | 55.2% |
[ 3.0% - 3.5% ] 3.34% | 209,912 | 42.2% |
[ 3.0% - 3.5% ] 3.38% | 6,770 | 59.1% |
[ 3.0% - 3.5% ] 3.47% | 44,105 | 51.0% |
[ 3.5% - 4.0% ] 3.57% | 49,770 | 43.5% |
[ 3.5% - 4.0% ] 3.62% | 41,372 | 54.1% |
[ 3.5% - 4.0% ] 3.73% | 63,264 | 36.0% |
[ 3.5% - 4.0% ] 3.79% | 75,805 | 45.5% |
[ 3.5% - 4.0% ] 3.88% | 53,571 | 48.3% |
[ 3.5% - 4.0% ] 3.95% | 335,898 | 38.2% |
[ 4.0% - 4.5% ] 4.07% | 27,996 | 39.4% |
[ 4.0% - 4.5% ] 4.09% | 157,704 | 45.0% |
[ 4.0% - 4.5% ] 4.18% | 64,839 | 36.7% |
[ 4.0% - 4.5% ] 4.25% | 14,620 | 52.9% |
[ 4.0% - 4.5% ] 4.33% | 327,503 | 30.2% |
[ 4.0% - 4.5% ] 4.43% | 10,335 | 65.1% |
[ 4.5% - 5.0% ] 4.51% | 33,414 | 55.9% |
[ 4.5% - 5.0% ] 4.56% | 86,913 | 61.3% |
[ 4.5% - 5.0% ] 4.68% | 18,822 | 42.8% |
[ 4.5% - 5.0% ] 4.78% | 6,027 | 48.4% |
[ 4.5% - 5.0% ] 4.84% | 43,421 | 46.2% |
[ 4.5% - 5.0% ] 4.88% | 38,008 | 38.3% |
[ 4.5% - 5.0% ] 4.98% | 28,729 | 36.6% |
[ 5.0% - 5.5% ] 5.06% | 158 | 36.2% |
[ 5.0% - 5.5% ] 5.14% | 139,266 | 46.0% |
[ 5.0% - 5.5% ] 5.26% | 68,427 | 52.8% |
[ 5.0% - 5.5% ] 5.33% | 863 | 32.4% |
[ 5.0% - 5.5% ] 5.46% | 9,612 | 40.7% |
[ 5.5% - 6.0% ] 5.56% | 16,684 | 51.3% |
[ 5.5% - 6.0% ] 5.62% | 130,926 | 45.0% |
[ 5.5% - 6.0% ] 5.70% | 48,457 | 32.2% |
[ 5.5% - 6.0% ] 5.77% | 132,036 | 46.2% |
[ 5.5% - 6.0% ] 5.88% | 10,921 | 65.1% |
[ 5.5% - 6.0% ] 5.93% | 65,215 | 44.3% |
[ 6.0% - 6.5% ] 6.13% | 8,775 | 33.6% |
[ 6.0% - 6.5% ] 6.21% | 54,125 | 40.7% |
[ 6.0% - 6.5% ] 6.29% | 39,028 | 57.5% |
[ 6.5% - 7.0% ] 6.50% | 46,595 | 38.0% |
[ 6.5% - 7.0% ] 6.61% | 12,940 | 63.0% |
[ 6.5% - 7.0% ] 6.69% | 2,826 | 65.9% |
[ 6.5% - 7.0% ] 6.75% | 548 | 77.1% |
[ 6.5% - 7.0% ] 6.88% | 33,691 | 49.5% |
[ 6.5% - 7.0% ] 6.99% | 58,595 | 66.6% |
[ 7.0% - 7.5% ] 7.09% | 48,922 | 51.5% |
[ 7.0% - 7.5% ] 7.32% | 2,718 | 51.3% |
[ 7.0% - 7.5% ] 7.41% | 54 | 39.3% |
[ 7.0% - 7.5% ] 7.48% | 441 | 63.5% |
[ 7.5% - 8.0% ] 7.63% | 32,076 | 38.0% |
[ 7.5% - 8.0% ] 7.73% | 54,957 | 43.3% |
[ 7.5% - 8.0% ] 7.78% | 13,154 | 28.7% |
[ 8.0% - 8.5% ] 8.01% | 11,929 | 63.1% |
[ 8.0% - 8.5% ] 8.12% | 1,428 | 37.1% |
[ 8.0% - 8.5% ] 8.22% | 608 | 43.0% |
[ 8.0% - 8.5% ] 8.46% | 86,455 | 37.4% |
[ 8.5% - 9.0% ] 8.55% | 117 | 42.6% |
[ 8.5% - 9.0% ] 8.64% | 4,259 | 45.1% |
[ 9.0% - 9.5% ] 9.02% | 11,551 | 36.6% |
[ 9.5% - 10.0% ] 9.81% | 1,285 | 62.9% |
[ 9.5% - 10.0% ] 9.85% | 32,091 | 38.6% |
[ 9.5% - 10.0% ] 9.90% | 31,932 | 38.5% |
[ 10.0% - 10.5% ] 10.22% | 60,009 | 41.6% |
[ 10.5% - 11.0% ] 10.82% | 152,106 | 48.6% |
[ 11.0% - 11.5% ] 11.02% | 82,782 | 47.3% |
[ 11.0% - 11.5% ] 11.46% | 5,159 | 50.6% |
[ 11.5% - 12.0% ] 11.77% | 27,569 | 49.3% |
[ 11.5% - 12.0% ] 11.86% | 59 | 65.6% |
[ 12.0% - 12.5% ] 12.04% | 97,370 | 40.6% |
[ 12.0% - 12.5% ] 12.37% | 45,694 | 52.7% |
[ 13.0% - 13.5% ] 13.26% | 181 | 20.4% |
[ 13.5% - 14.0% ] 13.52% | 17,178 | 38.5% |
[ 13.5% - 14.0% ] 13.92% | 237 | 15.8% |
[ 14.0% - 14.5% ] 14.32% | 8,547 | 41.5% |
[ 15.0% - 15.5% ] 15.21% | 4,418 | 34.4% |
[ 15.5% - 16.0% ] 15.97% | 2,367 | 29.0% |
[ 16.0% - 16.5% ] 16.23% | 154 | 55.3% |
[ 16.5% - 17.0% ] 16.65% | 38,898 | 43.9% |
[ 19.0% - 19.5% ] 19.37% | 56,696 | 42.9% |
[ 21.0% - 21.5% ] 21.06% | 1,016 | 30.5% |