Immigrants from Brazil Wage/Income Gap
COMPARE
Immigrants from Brazil
Select to Compare
Wage/Income Gap
Immigrants from Brazil Wage/Income Gap
27.0%
WAGE/INCOME GAP
5.0/ 100
METRIC RATING
233rd/ 347
METRIC RANK
Immigrants from Brazil Wage/Income Gap Correlation Chart
The statistical analysis conducted on geographies consisting of 342,853,162 people shows no correlation between the proportion of Immigrants from Brazil and wage/income gap percentage in the United States with a correlation coefficient (R) of 0.049 and weighted average of 27.0%. On average, for every 1% (one percent) increase in Immigrants from Brazil within a typical geography, there is an increase of 0.13% in wage/income gap percentage.
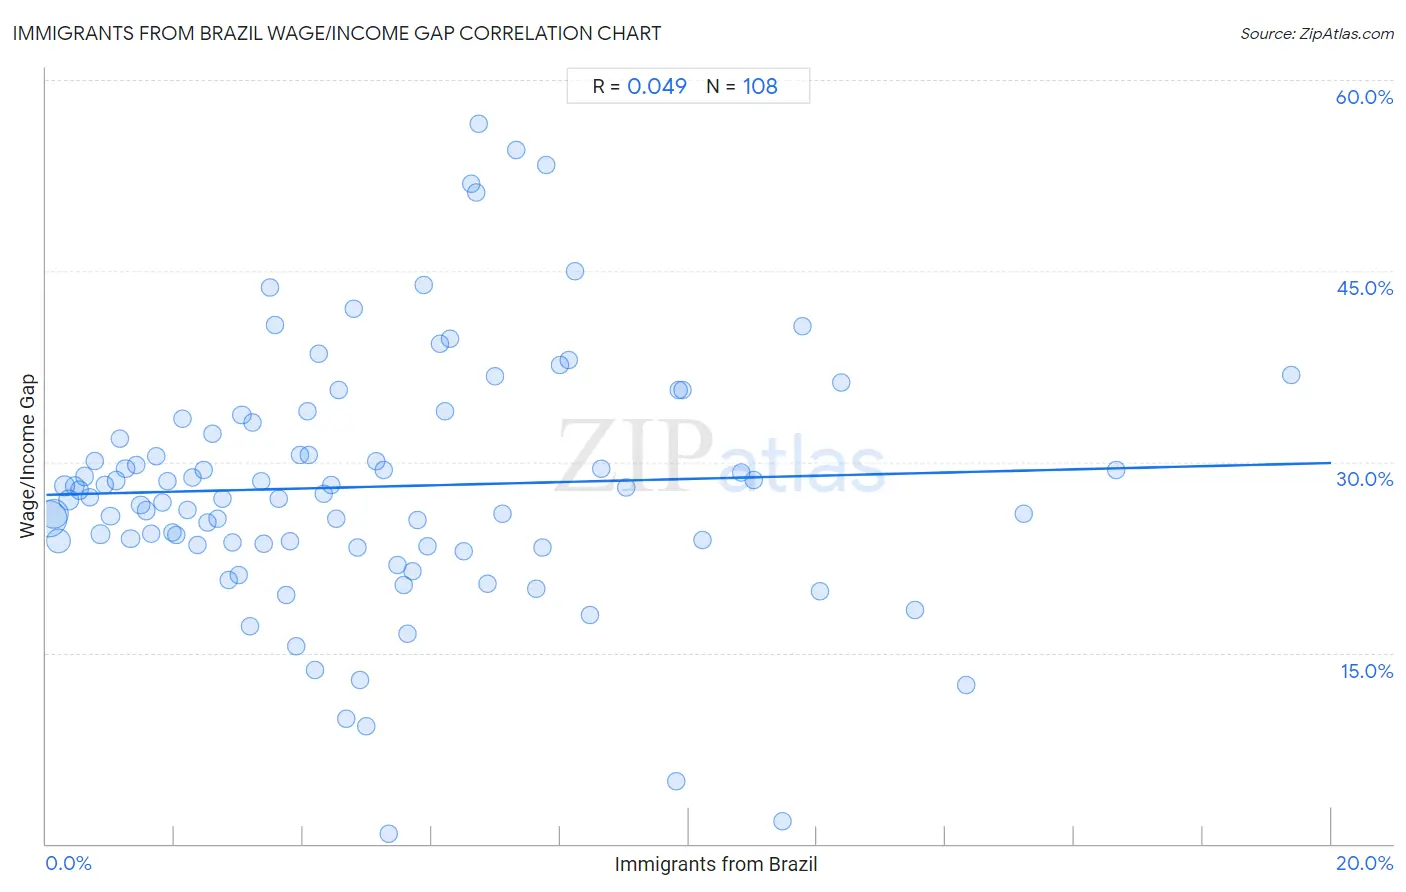
It is essential to understand that the correlation between the percentage of Immigrants from Brazil and wage/income gap percentage does not imply a direct cause-and-effect relationship. It remains uncertain whether the presence of Immigrants from Brazil influences an upward or downward trend in the level of wage/income gap percentage within an area, or if Immigrants from Brazil simply ended up residing in those areas with higher or lower levels of wage/income gap percentage due to other factors.
Demographics Similar to Immigrants from Brazil by Wage/Income Gap
In terms of wage/income gap, the demographic groups most similar to Immigrants from Brazil are Immigrants from Pakistan (27.0%, a difference of 0.050%), Argentinean (27.0%, a difference of 0.060%), Immigrants from Hungary (27.0%, a difference of 0.060%), Bhutanese (27.0%, a difference of 0.080%), and Immigrants from Romania (27.0%, a difference of 0.080%).
| Demographics | Rating | Rank | Wage/Income Gap |
| Asians | 5.9 /100 | #226 | Tragic 26.9% |
| Spaniards | 5.6 /100 | #227 | Tragic 27.0% |
| Immigrants from Turkey | 5.6 /100 | #228 | Tragic 27.0% |
| Immigrants from Asia | 5.5 /100 | #229 | Tragic 27.0% |
| Ottawa | 5.3 /100 | #230 | Tragic 27.0% |
| Bhutanese | 5.3 /100 | #231 | Tragic 27.0% |
| Argentineans | 5.2 /100 | #232 | Tragic 27.0% |
| Immigrants from Brazil | 5.0 /100 | #233 | Tragic 27.0% |
| Immigrants from Pakistan | 4.9 /100 | #234 | Tragic 27.0% |
| Immigrants from Hungary | 4.8 /100 | #235 | Tragic 27.0% |
| Immigrants from Romania | 4.8 /100 | #236 | Tragic 27.0% |
| Immigrants from Eastern Asia | 4.4 /100 | #237 | Tragic 27.1% |
| Osage | 4.4 /100 | #238 | Tragic 27.1% |
| Estonians | 4.3 /100 | #239 | Tragic 27.1% |
| Immigrants from Europe | 3.8 /100 | #240 | Tragic 27.1% |
Immigrants from Brazil Wage/Income Gap Correlation Summary
| Measurement | Immigrants from Brazil Data | Wage/Income Gap Data |
| Minimum | 0.039% | 0.81% |
| Maximum | 19.4% | 56.6% |
| Range | 19.3% | 55.7% |
| Mean | 5.1% | 28.0% |
| Median | 4.3% | 27.4% |
| Interquartile 25% (IQ1) | 2.2% | 23.5% |
| Interquartile 75% (IQ3) | 6.9% | 32.7% |
| Interquartile Range (IQR) | 4.8% | 9.2% |
| Standard Deviation (Sample) | 3.9% | 9.9% |
| Standard Deviation (Population) | 3.9% | 9.9% |
Correlation Details
| Immigrants from Brazil Percentile | Sample Size | Wage/Income Gap |
[ 0.0% - 0.5% ] 0.039% | 128,445,245 | 25.6% |
[ 0.0% - 0.5% ] 0.12% | 76,060,055 | 25.9% |
[ 0.0% - 0.5% ] 0.19% | 47,088,082 | 23.8% |
[ 0.0% - 0.5% ] 0.28% | 22,664,147 | 28.1% |
[ 0.0% - 0.5% ] 0.36% | 16,982,227 | 27.0% |
[ 0.0% - 0.5% ] 0.44% | 11,185,551 | 28.1% |
[ 0.5% - 1.0% ] 0.52% | 6,394,588 | 27.7% |
[ 0.5% - 1.0% ] 0.60% | 5,776,216 | 28.8% |
[ 0.5% - 1.0% ] 0.68% | 2,889,601 | 27.2% |
[ 0.5% - 1.0% ] 0.75% | 3,313,604 | 30.1% |
[ 0.5% - 1.0% ] 0.84% | 2,291,671 | 24.3% |
[ 0.5% - 1.0% ] 0.91% | 2,602,631 | 28.2% |
[ 0.5% - 1.0% ] 1.00% | 1,718,783 | 25.8% |
[ 1.0% - 1.5% ] 1.08% | 1,257,407 | 28.5% |
[ 1.0% - 1.5% ] 1.15% | 1,368,282 | 31.8% |
[ 1.0% - 1.5% ] 1.24% | 931,136 | 29.5% |
[ 1.0% - 1.5% ] 1.31% | 824,676 | 24.0% |
[ 1.0% - 1.5% ] 1.40% | 502,515 | 29.8% |
[ 1.0% - 1.5% ] 1.47% | 501,273 | 26.7% |
[ 1.5% - 2.0% ] 1.56% | 486,343 | 26.2% |
[ 1.5% - 2.0% ] 1.64% | 628,996 | 24.3% |
[ 1.5% - 2.0% ] 1.72% | 285,073 | 30.5% |
[ 1.5% - 2.0% ] 1.81% | 629,212 | 26.8% |
[ 1.5% - 2.0% ] 1.88% | 541,398 | 28.5% |
[ 1.5% - 2.0% ] 1.96% | 469,851 | 24.5% |
[ 2.0% - 2.5% ] 2.02% | 129,787 | 24.2% |
[ 2.0% - 2.5% ] 2.12% | 342,816 | 33.4% |
[ 2.0% - 2.5% ] 2.19% | 504,837 | 26.3% |
[ 2.0% - 2.5% ] 2.28% | 379,163 | 28.7% |
[ 2.0% - 2.5% ] 2.36% | 235,154 | 23.5% |
[ 2.0% - 2.5% ] 2.45% | 63,999 | 29.4% |
[ 2.5% - 3.0% ] 2.52% | 111,486 | 25.3% |
[ 2.5% - 3.0% ] 2.59% | 140,952 | 32.2% |
[ 2.5% - 3.0% ] 2.66% | 76,869 | 25.6% |
[ 2.5% - 3.0% ] 2.75% | 414,904 | 27.1% |
[ 2.5% - 3.0% ] 2.84% | 139,973 | 20.7% |
[ 2.5% - 3.0% ] 2.89% | 418,868 | 23.7% |
[ 3.0% - 3.5% ] 3.00% | 172,249 | 21.1% |
[ 3.0% - 3.5% ] 3.04% | 149,280 | 33.7% |
[ 3.0% - 3.5% ] 3.17% | 76,458 | 17.1% |
[ 3.0% - 3.5% ] 3.21% | 112,728 | 33.1% |
[ 3.0% - 3.5% ] 3.34% | 209,912 | 28.5% |
[ 3.0% - 3.5% ] 3.38% | 6,770 | 23.6% |
[ 3.0% - 3.5% ] 3.47% | 44,105 | 43.7% |
[ 3.5% - 4.0% ] 3.57% | 49,770 | 40.8% |
[ 3.5% - 4.0% ] 3.62% | 40,772 | 27.1% |
[ 3.5% - 4.0% ] 3.73% | 63,264 | 19.5% |
[ 3.5% - 4.0% ] 3.79% | 75,805 | 23.7% |
[ 3.5% - 4.0% ] 3.88% | 53,417 | 15.5% |
[ 3.5% - 4.0% ] 3.95% | 335,898 | 30.5% |
[ 4.0% - 4.5% ] 4.07% | 27,996 | 34.0% |
[ 4.0% - 4.5% ] 4.09% | 157,704 | 30.5% |
[ 4.0% - 4.5% ] 4.18% | 64,839 | 13.6% |
[ 4.0% - 4.5% ] 4.25% | 13,965 | 38.5% |
[ 4.0% - 4.5% ] 4.33% | 327,503 | 27.5% |
[ 4.0% - 4.5% ] 4.43% | 10,335 | 28.2% |
[ 4.5% - 5.0% ] 4.51% | 33,414 | 25.5% |
[ 4.5% - 5.0% ] 4.56% | 86,913 | 35.7% |
[ 4.5% - 5.0% ] 4.68% | 18,822 | 9.8% |
[ 4.5% - 5.0% ] 4.78% | 6,027 | 42.0% |
[ 4.5% - 5.0% ] 4.84% | 43,173 | 23.3% |
[ 4.5% - 5.0% ] 4.88% | 38,008 | 12.9% |
[ 4.5% - 5.0% ] 4.98% | 27,692 | 9.2% |
[ 5.0% - 5.5% ] 5.14% | 139,266 | 30.1% |
[ 5.0% - 5.5% ] 5.26% | 68,427 | 29.4% |
[ 5.0% - 5.5% ] 5.33% | 863 | 0.81% |
[ 5.0% - 5.5% ] 5.46% | 9,612 | 21.9% |
[ 5.5% - 6.0% ] 5.56% | 16,684 | 20.3% |
[ 5.5% - 6.0% ] 5.62% | 130,926 | 16.5% |
[ 5.5% - 6.0% ] 5.70% | 48,457 | 21.4% |
[ 5.5% - 6.0% ] 5.77% | 132,036 | 25.5% |
[ 5.5% - 6.0% ] 5.88% | 10,018 | 43.9% |
[ 5.5% - 6.0% ] 5.93% | 65,215 | 23.3% |
[ 6.0% - 6.5% ] 6.13% | 8,775 | 39.3% |
[ 6.0% - 6.5% ] 6.21% | 54,125 | 34.0% |
[ 6.0% - 6.5% ] 6.29% | 39,028 | 39.6% |
[ 6.5% - 7.0% ] 6.50% | 46,595 | 23.0% |
[ 6.5% - 7.0% ] 6.61% | 12,940 | 51.9% |
[ 6.5% - 7.0% ] 6.69% | 2,826 | 51.1% |
[ 6.5% - 7.0% ] 6.73% | 1,204 | 56.6% |
[ 6.5% - 7.0% ] 6.88% | 33,691 | 20.4% |
[ 6.5% - 7.0% ] 6.99% | 58,595 | 36.8% |
[ 7.0% - 7.5% ] 7.09% | 48,922 | 26.0% |
[ 7.0% - 7.5% ] 7.32% | 2,718 | 54.5% |
[ 7.5% - 8.0% ] 7.63% | 32,076 | 20.0% |
[ 7.5% - 8.0% ] 7.73% | 54,957 | 23.3% |
[ 7.5% - 8.0% ] 7.78% | 13,154 | 53.3% |
[ 8.0% - 8.5% ] 8.01% | 11,929 | 37.6% |
[ 8.0% - 8.5% ] 8.12% | 1,428 | 38.0% |
[ 8.0% - 8.5% ] 8.22% | 608 | 44.9% |
[ 8.0% - 8.5% ] 8.46% | 86,455 | 17.9% |
[ 8.5% - 9.0% ] 8.64% | 4,259 | 29.5% |
[ 9.0% - 9.5% ] 9.02% | 11,551 | 28.0% |
[ 9.5% - 10.0% ] 9.81% | 1,183 | 4.9% |
[ 9.5% - 10.0% ] 9.85% | 32,091 | 35.6% |
[ 9.5% - 10.0% ] 9.90% | 31,932 | 35.7% |
[ 10.0% - 10.5% ] 10.22% | 60,009 | 23.9% |
[ 10.5% - 11.0% ] 10.82% | 152,106 | 29.1% |
[ 11.0% - 11.5% ] 11.02% | 82,782 | 28.6% |
[ 11.0% - 11.5% ] 11.46% | 5,159 | 1.8% |
[ 11.5% - 12.0% ] 11.77% | 27,569 | 40.6% |
[ 12.0% - 12.5% ] 12.04% | 97,370 | 19.9% |
[ 12.0% - 12.5% ] 12.37% | 45,694 | 36.2% |
[ 13.5% - 14.0% ] 13.52% | 17,178 | 18.4% |
[ 14.0% - 14.5% ] 14.32% | 8,547 | 12.4% |
[ 15.0% - 15.5% ] 15.21% | 4,418 | 26.0% |
[ 16.5% - 17.0% ] 16.65% | 38,898 | 29.4% |
[ 19.0% - 19.5% ] 19.37% | 56,696 | 36.9% |