Immigrants Married-couple Households
COMPARE
Immigrants
Select to Compare
Married-couple Households
Immigrants Married-couple Households
46.3%
MARRIED-COUPLE HOUSEHOLDS
43.8/ 100
METRIC RATING
177th/ 347
METRIC RANK
Immigrants Married-couple Households Correlation Chart
The statistical analysis conducted on geographies consisting of 577,047,094 people shows no correlation between the proportion of Immigrants and percentage of married-couple family households in the United States with a correlation coefficient (R) of -0.018 and weighted average of 46.3%. On average, for every 1% (one percent) increase in Immigrants within a typical geography, there is a decrease of 0.0048% in percentage of married-couple family households.
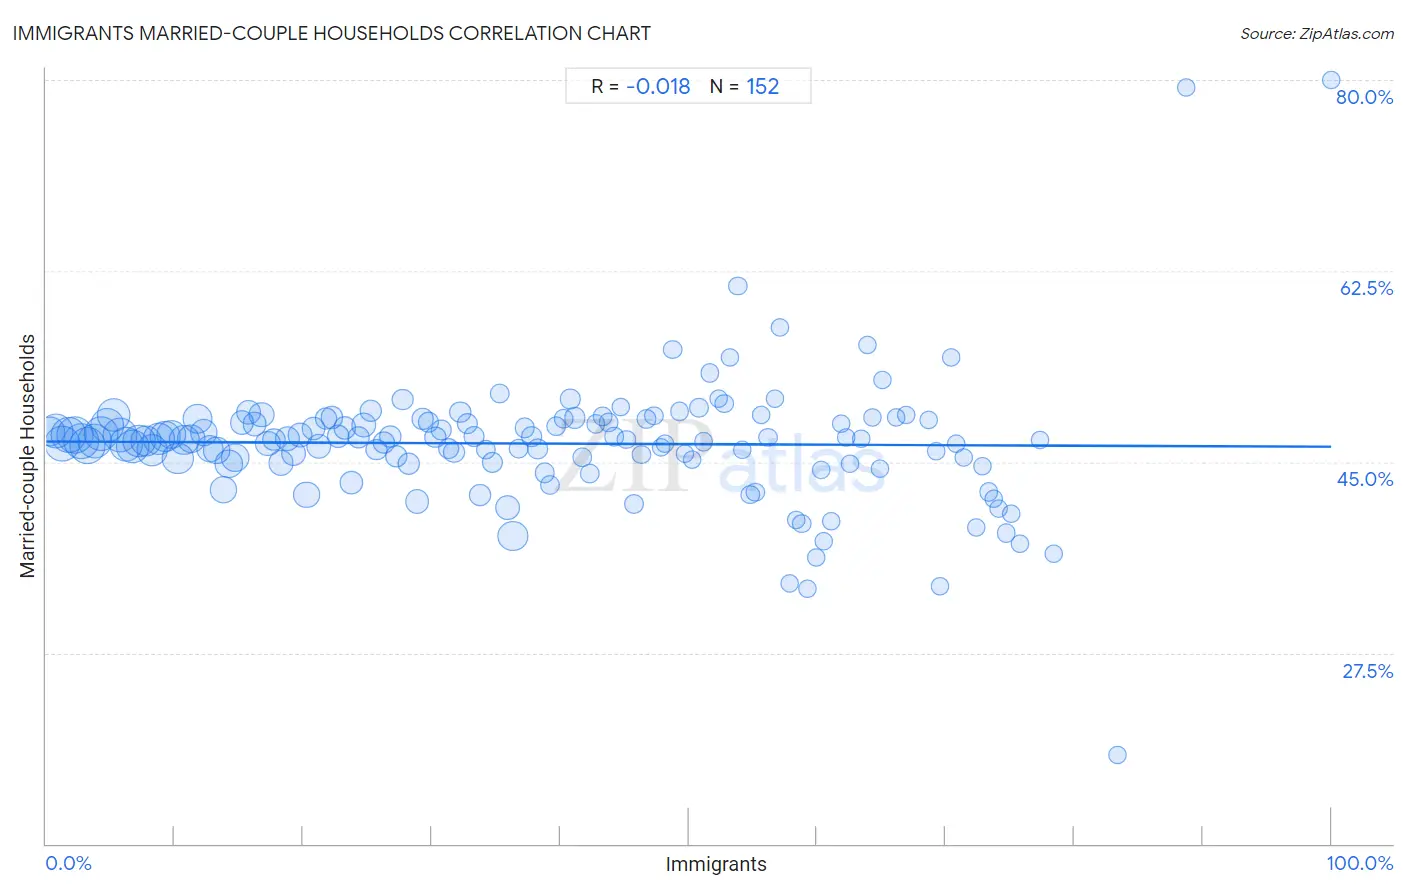
It is essential to understand that the correlation between the percentage of Immigrants and percentage of married-couple family households does not imply a direct cause-and-effect relationship. It remains uncertain whether the presence of Immigrants influences an upward or downward trend in the level of percentage of married-couple family households within an area, or if Immigrants simply ended up residing in those areas with higher or lower levels of percentage of married-couple family households due to other factors.
Demographics Similar to Immigrants by Married-couple Households
In terms of married-couple households, the demographic groups most similar to Immigrants are Immigrants from Costa Rica (46.3%, a difference of 0.020%), Immigrants from Zimbabwe (46.3%, a difference of 0.030%), Cajun (46.4%, a difference of 0.060%), Mongolian (46.3%, a difference of 0.070%), and Malaysian (46.3%, a difference of 0.080%).
| Demographics | Rating | Rank | Married-couple Households |
| South Americans | 58.0 /100 | #170 | Average 46.6% |
| Immigrants from Chile | 55.7 /100 | #171 | Average 46.5% |
| Immigrants from Australia | 54.6 /100 | #172 | Average 46.5% |
| Immigrants from Norway | 52.0 /100 | #173 | Average 46.5% |
| Immigrants from Mexico | 50.0 /100 | #174 | Average 46.4% |
| Immigrants from Colombia | 46.1 /100 | #175 | Average 46.4% |
| Cajuns | 45.2 /100 | #176 | Average 46.4% |
| Immigrants | 43.8 /100 | #177 | Average 46.3% |
| Immigrants from Costa Rica | 43.4 /100 | #178 | Average 46.3% |
| Immigrants from Zimbabwe | 43.0 /100 | #179 | Average 46.3% |
| Mongolians | 42.0 /100 | #180 | Average 46.3% |
| Malaysians | 41.8 /100 | #181 | Average 46.3% |
| Yugoslavians | 38.9 /100 | #182 | Fair 46.2% |
| Immigrants from Brazil | 38.3 /100 | #183 | Fair 46.2% |
| Immigrants from Switzerland | 36.9 /100 | #184 | Fair 46.2% |
Immigrants Married-couple Households Correlation Summary
| Measurement | Immigrants Data | Married-couple Households Data |
| Minimum | 0.28% | 18.2% |
| Maximum | 100.0% | 80.0% |
| Range | 99.7% | 61.8% |
| Mean | 38.6% | 46.7% |
| Median | 38.0% | 47.1% |
| Interquartile 25% (IQ1) | 19.0% | 45.1% |
| Interquartile 75% (IQ3) | 56.9% | 48.7% |
| Interquartile Range (IQR) | 37.9% | 3.7% |
| Standard Deviation (Sample) | 23.0% | 6.1% |
| Standard Deviation (Population) | 23.0% | 6.1% |
Correlation Details
| Immigrants Percentile | Sample Size | Married-couple Households |
[ 0.0% - 0.5% ] 0.28% | 9,772,397 | 47.8% |
[ 0.5% - 1.0% ] 0.76% | 14,920,770 | 47.9% |
[ 1.0% - 1.5% ] 1.25% | 15,909,208 | 46.7% |
[ 1.5% - 2.0% ] 1.75% | 15,749,499 | 47.5% |
[ 2.0% - 2.5% ] 2.24% | 16,722,372 | 47.4% |
[ 2.5% - 3.0% ] 2.74% | 15,737,872 | 46.9% |
[ 3.0% - 3.5% ] 3.24% | 15,716,016 | 46.5% |
[ 3.5% - 4.0% ] 3.75% | 14,887,990 | 46.9% |
[ 4.0% - 4.5% ] 4.25% | 14,667,408 | 47.6% |
[ 4.5% - 5.0% ] 4.75% | 13,920,176 | 48.3% |
[ 5.0% - 5.5% ] 5.26% | 13,493,957 | 49.3% |
[ 5.5% - 6.0% ] 5.75% | 14,478,511 | 47.5% |
[ 6.0% - 6.5% ] 6.24% | 13,690,513 | 46.6% |
[ 6.5% - 7.0% ] 6.75% | 13,095,432 | 46.4% |
[ 7.0% - 7.5% ] 7.24% | 12,639,947 | 46.9% |
[ 7.5% - 8.0% ] 7.74% | 11,601,623 | 46.9% |
[ 8.0% - 8.5% ] 8.23% | 11,963,337 | 46.1% |
[ 8.5% - 9.0% ] 8.74% | 12,111,221 | 47.2% |
[ 9.0% - 9.5% ] 9.25% | 10,782,003 | 47.3% |
[ 9.5% - 10.0% ] 9.76% | 9,891,100 | 47.5% |
[ 10.0% - 10.5% ] 10.26% | 11,700,172 | 45.3% |
[ 10.5% - 11.0% ] 10.74% | 10,236,073 | 47.0% |
[ 11.0% - 11.5% ] 11.24% | 8,914,898 | 47.1% |
[ 11.5% - 12.0% ] 11.76% | 9,972,957 | 48.9% |
[ 12.0% - 12.5% ] 12.22% | 7,661,066 | 47.7% |
[ 12.5% - 13.0% ] 12.75% | 7,939,775 | 46.2% |
[ 13.0% - 13.5% ] 13.25% | 7,146,965 | 46.0% |
[ 13.5% - 14.0% ] 13.80% | 8,315,339 | 42.4% |
[ 14.0% - 14.5% ] 14.24% | 8,820,735 | 44.8% |
[ 14.5% - 15.0% ] 14.73% | 8,592,085 | 45.4% |
[ 15.0% - 15.5% ] 15.23% | 5,435,466 | 48.6% |
[ 15.5% - 16.0% ] 15.77% | 5,918,594 | 49.6% |
[ 16.0% - 16.5% ] 16.23% | 5,021,206 | 48.5% |
[ 16.5% - 17.0% ] 16.74% | 6,104,215 | 49.3% |
[ 17.0% - 17.5% ] 17.25% | 5,951,822 | 46.7% |
[ 17.5% - 18.0% ] 17.70% | 4,131,630 | 47.0% |
[ 18.0% - 18.5% ] 18.25% | 5,997,076 | 44.9% |
[ 18.5% - 19.0% ] 18.78% | 5,660,197 | 47.2% |
[ 19.0% - 19.5% ] 19.26% | 5,943,170 | 45.7% |
[ 19.5% - 20.0% ] 19.74% | 5,474,651 | 47.4% |
[ 20.0% - 20.5% ] 20.27% | 7,111,349 | 42.0% |
[ 20.5% - 21.0% ] 20.77% | 4,832,158 | 48.1% |
[ 21.0% - 21.5% ] 21.23% | 5,561,499 | 46.4% |
[ 21.5% - 22.0% ] 21.77% | 3,714,492 | 49.0% |
[ 22.0% - 22.5% ] 22.23% | 4,428,086 | 49.0% |
[ 22.5% - 23.0% ] 22.73% | 4,305,206 | 47.4% |
[ 23.0% - 23.5% ] 23.24% | 3,757,247 | 48.1% |
[ 23.5% - 24.0% ] 23.76% | 4,203,935 | 43.1% |
[ 24.0% - 24.5% ] 24.28% | 3,614,601 | 47.2% |
[ 24.5% - 25.0% ] 24.75% | 5,524,563 | 48.4% |
[ 25.0% - 25.5% ] 25.25% | 4,176,946 | 49.7% |
[ 25.5% - 26.0% ] 25.69% | 2,919,510 | 46.1% |
[ 26.0% - 26.5% ] 26.24% | 3,199,820 | 46.8% |
[ 26.5% - 27.0% ] 26.76% | 2,756,027 | 47.3% |
[ 27.0% - 27.5% ] 27.27% | 3,317,392 | 45.5% |
[ 27.5% - 28.0% ] 27.73% | 2,970,542 | 50.7% |
[ 28.0% - 28.5% ] 28.24% | 3,349,114 | 44.8% |
[ 28.5% - 29.0% ] 28.86% | 5,113,487 | 41.3% |
[ 29.0% - 29.5% ] 29.27% | 3,120,426 | 49.0% |
[ 29.5% - 30.0% ] 29.76% | 2,779,639 | 48.7% |
[ 30.0% - 30.5% ] 30.27% | 2,702,620 | 47.3% |
[ 30.5% - 31.0% ] 30.74% | 2,241,401 | 47.9% |
[ 31.0% - 31.5% ] 31.31% | 2,414,630 | 46.2% |
[ 31.5% - 32.0% ] 31.75% | 2,833,535 | 45.9% |
[ 32.0% - 32.5% ] 32.21% | 2,889,922 | 49.5% |
[ 32.5% - 33.0% ] 32.75% | 2,370,101 | 48.5% |
[ 33.0% - 33.5% ] 33.27% | 1,734,712 | 47.3% |
[ 33.5% - 34.0% ] 33.74% | 3,250,013 | 41.9% |
[ 34.0% - 34.5% ] 34.23% | 1,749,851 | 46.1% |
[ 34.5% - 35.0% ] 34.74% | 2,390,824 | 45.0% |
[ 35.0% - 35.5% ] 35.26% | 1,587,095 | 51.3% |
[ 35.5% - 36.0% ] 35.91% | 5,381,391 | 40.8% |
[ 36.0% - 36.5% ] 36.32% | 10,447,094 | 38.2% |
[ 36.5% - 37.0% ] 36.77% | 1,322,357 | 46.3% |
[ 37.0% - 37.5% ] 37.26% | 1,598,123 | 48.1% |
[ 37.5% - 38.0% ] 37.76% | 1,537,537 | 47.3% |
[ 38.0% - 38.5% ] 38.23% | 1,934,643 | 46.2% |
[ 38.5% - 39.0% ] 38.81% | 1,612,241 | 44.0% |
[ 39.0% - 39.5% ] 39.23% | 1,154,486 | 42.8% |
[ 39.5% - 40.0% ] 39.69% | 1,209,871 | 48.2% |
[ 40.0% - 40.5% ] 40.25% | 1,249,653 | 48.9% |
[ 40.5% - 41.0% ] 40.76% | 1,733,706 | 50.7% |
[ 41.0% - 41.5% ] 41.11% | 2,639,001 | 49.0% |
[ 41.5% - 42.0% ] 41.73% | 1,525,927 | 45.4% |
[ 42.0% - 42.5% ] 42.28% | 1,501,804 | 44.0% |
[ 42.5% - 43.0% ] 42.78% | 816,236 | 48.4% |
[ 43.0% - 43.5% ] 43.26% | 890,544 | 49.2% |
[ 43.5% - 44.0% ] 43.79% | 1,290,311 | 48.6% |
[ 44.0% - 44.5% ] 44.20% | 369,253 | 47.3% |
[ 44.5% - 45.0% ] 44.72% | 858,656 | 50.0% |
[ 45.0% - 45.5% ] 45.14% | 871,806 | 47.0% |
[ 45.5% - 46.0% ] 45.75% | 710,381 | 41.1% |
[ 46.0% - 46.5% ] 46.30% | 775,976 | 45.7% |
[ 46.5% - 47.0% ] 46.72% | 708,284 | 49.0% |
[ 47.0% - 47.5% ] 47.30% | 841,371 | 49.2% |
[ 47.5% - 48.0% ] 47.83% | 277,561 | 46.4% |
[ 48.0% - 48.5% ] 48.14% | 169,826 | 46.6% |
[ 48.5% - 49.0% ] 48.74% | 845,868 | 55.3% |
[ 49.0% - 49.5% ] 49.28% | 847,079 | 49.6% |
[ 49.5% - 50.0% ] 49.69% | 166,054 | 45.8% |
[ 50.0% - 50.5% ] 50.28% | 640,490 | 45.2% |
[ 50.5% - 51.0% ] 50.79% | 730,765 | 50.0% |
[ 51.0% - 51.5% ] 51.18% | 322,007 | 46.8% |
[ 51.5% - 52.0% ] 51.67% | 305,963 | 53.2% |
[ 52.0% - 52.5% ] 52.32% | 205,023 | 50.8% |
[ 52.5% - 53.0% ] 52.76% | 236,458 | 50.3% |
[ 53.0% - 53.5% ] 53.23% | 137,110 | 54.5% |
[ 53.5% - 54.0% ] 53.81% | 463,502 | 61.1% |
[ 54.0% - 54.5% ] 54.17% | 375,384 | 46.1% |
[ 54.5% - 55.0% ] 54.78% | 593,749 | 42.0% |
[ 55.0% - 55.5% ] 55.18% | 482,171 | 42.2% |
[ 55.5% - 56.0% ] 55.61% | 148,599 | 49.3% |
[ 56.0% - 56.5% ] 56.17% | 91,519 | 47.2% |
[ 56.5% - 57.0% ] 56.72% | 75,873 | 50.8% |
[ 57.0% - 57.5% ] 57.13% | 110,585 | 57.4% |
[ 57.5% - 58.0% ] 57.84% | 598,269 | 33.9% |
[ 58.0% - 58.5% ] 58.34% | 98,862 | 39.7% |
[ 58.5% - 59.0% ] 58.80% | 221,572 | 39.3% |
[ 59.0% - 59.5% ] 59.19% | 86,905 | 33.4% |
[ 59.5% - 60.0% ] 59.92% | 16,029 | 36.2% |
[ 60.0% - 60.5% ] 60.30% | 154,064 | 44.3% |
[ 60.5% - 61.0% ] 60.53% | 36,392 | 37.8% |
[ 61.0% - 61.5% ] 61.13% | 58,079 | 39.6% |
[ 61.5% - 62.0% ] 61.88% | 128,876 | 48.5% |
[ 62.0% - 62.5% ] 62.28% | 94,247 | 47.2% |
[ 62.5% - 63.0% ] 62.58% | 26,268 | 44.8% |
[ 63.0% - 63.5% ] 63.43% | 26,503 | 47.1% |
[ 63.5% - 64.0% ] 63.91% | 117,426 | 55.7% |
[ 64.0% - 64.5% ] 64.33% | 109,357 | 49.0% |
[ 64.5% - 65.0% ] 64.88% | 105,842 | 44.3% |
[ 65.0% - 65.5% ] 65.10% | 53,206 | 52.5% |
[ 66.0% - 66.5% ] 66.17% | 152,851 | 49.0% |
[ 66.5% - 67.0% ] 66.91% | 109,218 | 49.3% |
[ 68.5% - 69.0% ] 68.68% | 119,624 | 48.8% |
[ 69.0% - 69.5% ] 69.26% | 90,830 | 46.0% |
[ 69.5% - 70.0% ] 69.58% | 766 | 33.6% |
[ 70.0% - 70.5% ] 70.39% | 115,169 | 54.6% |
[ 70.5% - 71.0% ] 70.79% | 138,182 | 46.7% |
[ 71.0% - 71.5% ] 71.37% | 45,620 | 45.5% |
[ 72.0% - 72.5% ] 72.38% | 449 | 39.0% |
[ 72.5% - 73.0% ] 72.85% | 57,066 | 44.7% |
[ 73.0% - 73.5% ] 73.31% | 29,830 | 42.3% |
[ 73.5% - 74.0% ] 73.75% | 19,399 | 41.7% |
[ 74.0% - 74.5% ] 74.15% | 257,769 | 40.7% |
[ 74.5% - 75.0% ] 74.68% | 46,798 | 38.5% |
[ 75.0% - 75.5% ] 75.10% | 71,088 | 40.3% |
[ 75.5% - 76.0% ] 75.74% | 1,018 | 37.5% |
[ 77.0% - 77.5% ] 77.38% | 84 | 47.1% |
[ 78.0% - 78.5% ] 78.37% | 42,178 | 36.6% |
[ 83.0% - 83.5% ] 83.33% | 72 | 18.2% |
[ 88.5% - 89.0% ] 88.69% | 168 | 79.3% |
[ 99.5% - 100.0% ] 100.00% | 593 | 80.0% |