Immigrants 3 or more Vehicles in Household
COMPARE
Immigrants
Select to Compare
3 or more Vehicles in Household
Immigrants 3 or more Vehicles in Household
20.0%
3+ VEHICLES AVAILABLE
80.8/ 100
METRIC RATING
150th/ 347
METRIC RANK
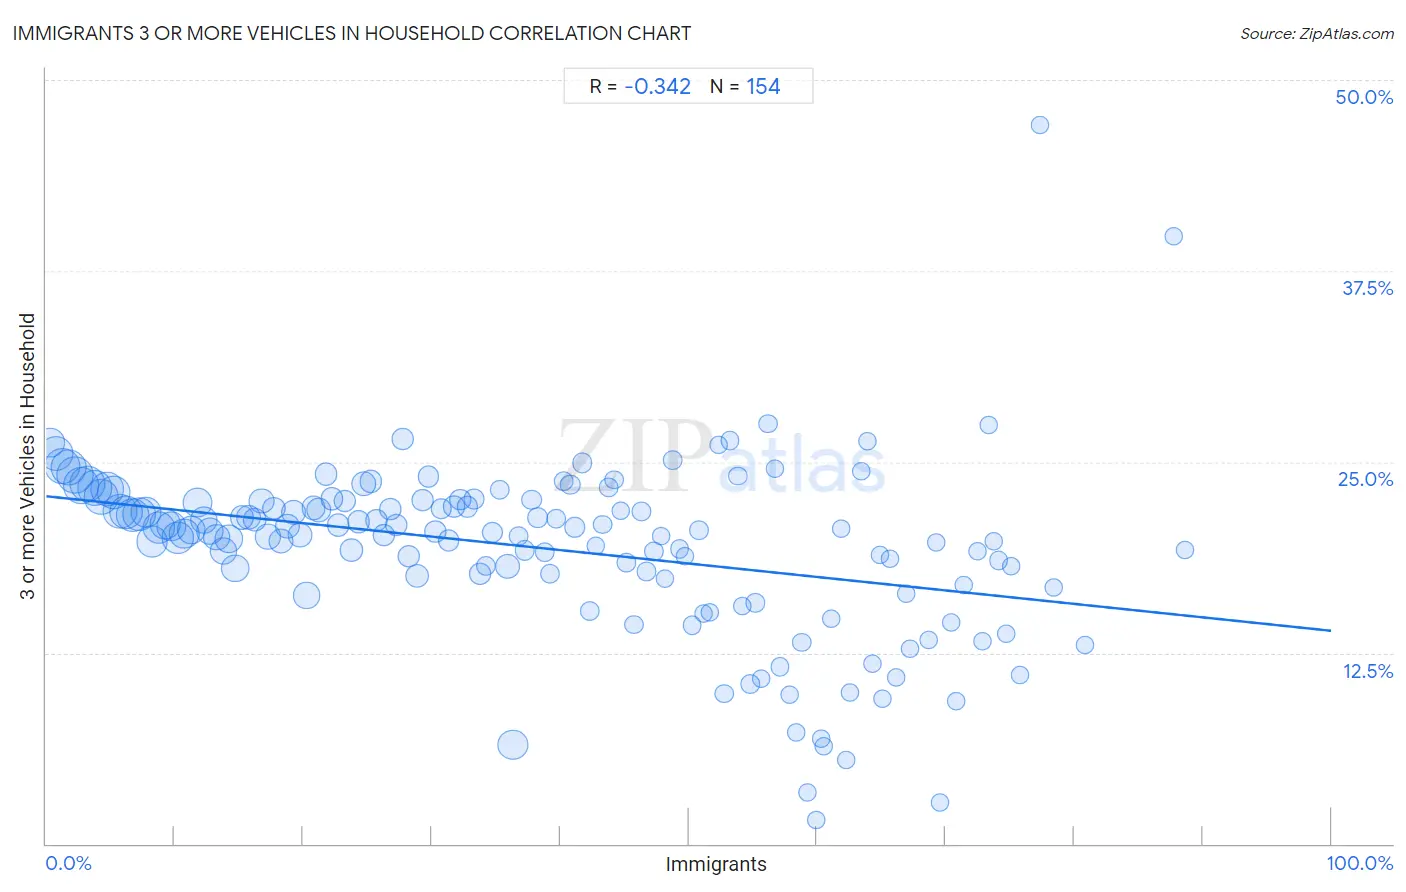
Immigrants 3 or more Vehicles in Household Correlation Chart
The statistical analysis conducted on geographies consisting of 576,716,995 people shows a mild negative correlation between the proportion of Immigrants and percentage of households with 3 or more vehicles available in the United States with a correlation coefficient (R) of -0.342 and weighted average of 20.0%. On average, for every 1% (one percent) increase in Immigrants within a typical geography, there is a decrease of 0.088% in percentage of households with 3 or more vehicles available.
It is essential to understand that the correlation between the percentage of Immigrants and percentage of households with 3 or more vehicles available does not imply a direct cause-and-effect relationship. It remains uncertain whether the presence of Immigrants influences an upward or downward trend in the level of percentage of households with 3 or more vehicles available within an area, or if Immigrants simply ended up residing in those areas with higher or lower levels of percentage of households with 3 or more vehicles available due to other factors.
Demographics Similar to Immigrants by 3 or more Vehicles in Household
In terms of 3 or more vehicles in household, the demographic groups most similar to Immigrants are Immigrants from Iran (20.0%, a difference of 0.020%), Taiwanese (20.0%, a difference of 0.020%), Lebanese (20.0%, a difference of 0.12%), Guatemalan (20.1%, a difference of 0.22%), and Slovak (20.1%, a difference of 0.28%).
| Demographics | Rating | Rank | 3 or more Vehicles in Household |
| Lithuanians | 84.4 /100 | #143 | Excellent 20.1% |
| Iranians | 84.0 /100 | #144 | Excellent 20.1% |
| Palestinians | 83.9 /100 | #145 | Excellent 20.1% |
| Australians | 83.6 /100 | #146 | Excellent 20.1% |
| Slovaks | 83.0 /100 | #147 | Excellent 20.1% |
| Guatemalans | 82.6 /100 | #148 | Excellent 20.1% |
| Immigrants from Iran | 80.9 /100 | #149 | Excellent 20.0% |
| Immigrants | 80.8 /100 | #150 | Excellent 20.0% |
| Taiwanese | 80.6 /100 | #151 | Excellent 20.0% |
| Lebanese | 79.8 /100 | #152 | Good 20.0% |
| Yuman | 75.6 /100 | #153 | Good 19.9% |
| Immigrants from Jordan | 75.0 /100 | #154 | Good 19.9% |
| Tlingit-Haida | 73.4 /100 | #155 | Good 19.9% |
| Thais | 71.1 /100 | #156 | Good 19.8% |
| Hungarians | 70.5 /100 | #157 | Good 19.8% |
Immigrants 3 or more Vehicles in Household Correlation Summary
| Measurement | Immigrants Data | 3 or more Vehicles in Household Data |
| Minimum | 0.28% | 1.6% |
| Maximum | 88.7% | 47.1% |
| Range | 88.4% | 45.5% |
| Mean | 38.8% | 19.3% |
| Median | 38.5% | 20.4% |
| Interquartile 25% (IQ1) | 19.3% | 17.4% |
| Interquartile 75% (IQ3) | 57.8% | 22.4% |
| Interquartile Range (IQR) | 38.6% | 5.1% |
| Standard Deviation (Sample) | 22.9% | 5.9% |
| Standard Deviation (Population) | 22.8% | 5.9% |
Correlation Details
| Immigrants Percentile | Sample Size | 3 or more Vehicles in Household |
[ 0.0% - 0.5% ] 0.28% | 9,762,229 | 26.3% |
[ 0.5% - 1.0% ] 0.76% | 14,914,109 | 25.6% |
[ 1.0% - 1.5% ] 1.25% | 15,899,857 | 24.8% |
[ 1.5% - 2.0% ] 1.75% | 15,741,347 | 24.7% |
[ 2.0% - 2.5% ] 2.24% | 16,713,301 | 24.1% |
[ 2.5% - 3.0% ] 2.74% | 15,732,970 | 23.5% |
[ 3.0% - 3.5% ] 3.24% | 15,707,976 | 23.6% |
[ 3.5% - 4.0% ] 3.75% | 14,885,145 | 23.3% |
[ 4.0% - 4.5% ] 4.25% | 14,658,253 | 22.7% |
[ 4.5% - 5.0% ] 4.75% | 13,911,582 | 23.2% |
[ 5.0% - 5.5% ] 5.26% | 13,478,204 | 23.0% |
[ 5.5% - 6.0% ] 5.75% | 14,475,078 | 21.7% |
[ 6.0% - 6.5% ] 6.24% | 13,687,988 | 21.7% |
[ 6.5% - 7.0% ] 6.75% | 13,088,957 | 21.5% |
[ 7.0% - 7.5% ] 7.24% | 12,636,833 | 21.6% |
[ 7.5% - 8.0% ] 7.74% | 11,607,983 | 21.7% |
[ 8.0% - 8.5% ] 8.23% | 11,958,261 | 19.8% |
[ 8.5% - 9.0% ] 8.74% | 12,107,308 | 20.7% |
[ 9.0% - 9.5% ] 9.25% | 10,773,518 | 20.9% |
[ 9.5% - 10.0% ] 9.76% | 9,883,599 | 20.8% |
[ 10.0% - 10.5% ] 10.26% | 11,677,145 | 20.0% |
[ 10.5% - 11.0% ] 10.74% | 10,233,492 | 20.3% |
[ 11.0% - 11.5% ] 11.24% | 8,913,736 | 20.6% |
[ 11.5% - 12.0% ] 11.76% | 9,970,235 | 22.3% |
[ 12.0% - 12.5% ] 12.22% | 7,659,882 | 21.2% |
[ 12.5% - 13.0% ] 12.75% | 7,937,030 | 20.5% |
[ 13.0% - 13.5% ] 13.25% | 7,145,263 | 20.1% |
[ 13.5% - 14.0% ] 13.80% | 8,314,499 | 19.2% |
[ 14.0% - 14.5% ] 14.24% | 8,813,375 | 20.0% |
[ 14.5% - 15.0% ] 14.73% | 8,582,544 | 18.0% |
[ 15.0% - 15.5% ] 15.23% | 5,433,573 | 21.3% |
[ 15.5% - 16.0% ] 15.77% | 5,916,851 | 21.4% |
[ 16.0% - 16.5% ] 16.23% | 5,016,015 | 21.2% |
[ 16.5% - 17.0% ] 16.74% | 6,090,872 | 22.4% |
[ 17.0% - 17.5% ] 17.25% | 5,950,225 | 20.1% |
[ 17.5% - 18.0% ] 17.70% | 4,128,725 | 22.0% |
[ 18.0% - 18.5% ] 18.25% | 5,996,380 | 19.8% |
[ 18.5% - 19.0% ] 18.78% | 5,652,749 | 20.8% |
[ 19.0% - 19.5% ] 19.26% | 5,940,700 | 21.7% |
[ 19.5% - 20.0% ] 19.74% | 5,463,366 | 20.2% |
[ 20.0% - 20.5% ] 20.27% | 7,111,109 | 16.3% |
[ 20.5% - 21.0% ] 20.77% | 4,831,490 | 22.0% |
[ 21.0% - 21.5% ] 21.23% | 5,553,782 | 21.9% |
[ 21.5% - 22.0% ] 21.77% | 3,713,166 | 24.2% |
[ 22.0% - 22.5% ] 22.23% | 4,422,535 | 22.6% |
[ 22.5% - 23.0% ] 22.73% | 4,307,260 | 20.9% |
[ 23.0% - 23.5% ] 23.24% | 3,755,828 | 22.4% |
[ 23.5% - 24.0% ] 23.76% | 4,203,935 | 19.2% |
[ 24.0% - 24.5% ] 24.28% | 3,602,864 | 21.1% |
[ 24.5% - 25.0% ] 24.75% | 5,523,374 | 23.6% |
[ 25.0% - 25.5% ] 25.25% | 4,173,468 | 23.7% |
[ 25.5% - 26.0% ] 25.69% | 2,915,737 | 21.2% |
[ 26.0% - 26.5% ] 26.24% | 3,199,595 | 20.2% |
[ 26.5% - 27.0% ] 26.76% | 2,756,536 | 21.9% |
[ 27.0% - 27.5% ] 27.27% | 3,317,191 | 20.9% |
[ 27.5% - 28.0% ] 27.73% | 2,970,267 | 26.5% |
[ 28.0% - 28.5% ] 28.24% | 3,347,104 | 18.8% |
[ 28.5% - 29.0% ] 28.86% | 5,103,826 | 17.5% |
[ 29.0% - 29.5% ] 29.27% | 3,116,656 | 22.5% |
[ 29.5% - 30.0% ] 29.76% | 2,779,026 | 24.0% |
[ 30.0% - 30.5% ] 30.27% | 2,702,423 | 20.4% |
[ 30.5% - 31.0% ] 30.74% | 2,240,968 | 22.0% |
[ 31.0% - 31.5% ] 31.31% | 2,414,630 | 19.8% |
[ 31.5% - 32.0% ] 31.75% | 2,833,093 | 22.1% |
[ 32.0% - 32.5% ] 32.21% | 2,889,312 | 22.5% |
[ 32.5% - 33.0% ] 32.75% | 2,370,240 | 22.1% |
[ 33.0% - 33.5% ] 33.27% | 1,734,703 | 22.6% |
[ 33.5% - 34.0% ] 33.74% | 3,249,176 | 17.7% |
[ 34.0% - 34.5% ] 34.23% | 1,749,851 | 18.2% |
[ 34.5% - 35.0% ] 34.74% | 2,389,585 | 20.4% |
[ 35.0% - 35.5% ] 35.26% | 1,580,590 | 23.2% |
[ 35.5% - 36.0% ] 35.91% | 5,381,391 | 18.2% |
[ 36.0% - 36.5% ] 36.32% | 10,447,094 | 6.5% |
[ 36.5% - 37.0% ] 36.77% | 1,320,314 | 20.1% |
[ 37.0% - 37.5% ] 37.26% | 1,597,185 | 19.2% |
[ 37.5% - 38.0% ] 37.76% | 1,537,447 | 22.5% |
[ 38.0% - 38.5% ] 38.23% | 1,934,213 | 21.4% |
[ 38.5% - 39.0% ] 38.81% | 1,594,488 | 19.1% |
[ 39.0% - 39.5% ] 39.23% | 1,154,157 | 17.6% |
[ 39.5% - 40.0% ] 39.69% | 1,202,591 | 21.3% |
[ 40.0% - 40.5% ] 40.25% | 1,249,465 | 23.7% |
[ 40.5% - 41.0% ] 40.76% | 1,733,432 | 23.5% |
[ 41.0% - 41.5% ] 41.11% | 2,639,001 | 20.7% |
[ 41.5% - 42.0% ] 41.73% | 1,525,733 | 24.9% |
[ 42.0% - 42.5% ] 42.28% | 1,501,212 | 15.2% |
[ 42.5% - 43.0% ] 42.78% | 816,229 | 19.5% |
[ 43.0% - 43.5% ] 43.26% | 890,335 | 20.9% |
[ 43.5% - 44.0% ] 43.79% | 1,289,951 | 23.3% |
[ 44.0% - 44.5% ] 44.20% | 369,253 | 23.8% |
[ 44.5% - 45.0% ] 44.72% | 858,618 | 21.8% |
[ 45.0% - 45.5% ] 45.14% | 871,806 | 18.4% |
[ 45.5% - 46.0% ] 45.75% | 710,208 | 14.3% |
[ 46.0% - 46.5% ] 46.30% | 775,935 | 21.7% |
[ 46.5% - 47.0% ] 46.72% | 708,122 | 17.8% |
[ 47.0% - 47.5% ] 47.30% | 841,252 | 19.1% |
[ 47.5% - 48.0% ] 47.83% | 277,496 | 20.1% |
[ 48.0% - 48.5% ] 48.14% | 169,522 | 17.4% |
[ 48.5% - 49.0% ] 48.74% | 845,868 | 25.1% |
[ 49.0% - 49.5% ] 49.28% | 847,079 | 19.3% |
[ 49.5% - 50.0% ] 49.69% | 166,042 | 18.8% |
[ 50.0% - 50.5% ] 50.28% | 640,490 | 14.3% |
[ 50.5% - 51.0% ] 50.79% | 730,765 | 20.5% |
[ 51.0% - 51.5% ] 51.18% | 322,007 | 15.0% |
[ 51.5% - 52.0% ] 51.67% | 305,734 | 15.1% |
[ 52.0% - 52.5% ] 52.32% | 205,023 | 26.1% |
[ 52.5% - 53.0% ] 52.76% | 236,458 | 9.8% |
[ 53.0% - 53.5% ] 53.23% | 137,110 | 26.4% |
[ 53.5% - 54.0% ] 53.81% | 463,502 | 24.1% |
[ 54.0% - 54.5% ] 54.17% | 373,060 | 15.6% |
[ 54.5% - 55.0% ] 54.78% | 593,749 | 10.5% |
[ 55.0% - 55.5% ] 55.18% | 482,104 | 15.8% |
[ 55.5% - 56.0% ] 55.61% | 148,590 | 10.8% |
[ 56.0% - 56.5% ] 56.17% | 91,391 | 27.5% |
[ 56.5% - 57.0% ] 56.72% | 75,873 | 24.5% |
[ 57.0% - 57.5% ] 57.13% | 110,508 | 11.6% |
[ 57.5% - 58.0% ] 57.84% | 598,269 | 9.8% |
[ 58.0% - 58.5% ] 58.34% | 98,862 | 7.3% |
[ 58.5% - 59.0% ] 58.80% | 221,533 | 13.2% |
[ 59.0% - 59.5% ] 59.19% | 86,873 | 3.3% |
[ 59.5% - 60.0% ] 59.92% | 14,740 | 1.6% |
[ 60.0% - 60.5% ] 60.30% | 154,064 | 6.9% |
[ 60.5% - 61.0% ] 60.53% | 36,392 | 6.4% |
[ 61.0% - 61.5% ] 61.13% | 58,079 | 14.7% |
[ 61.5% - 62.0% ] 61.88% | 128,876 | 20.6% |
[ 62.0% - 62.5% ] 62.28% | 94,090 | 5.5% |
[ 62.5% - 63.0% ] 62.58% | 26,268 | 9.9% |
[ 63.0% - 63.5% ] 63.43% | 24,681 | 24.4% |
[ 63.5% - 64.0% ] 63.91% | 115,768 | 26.3% |
[ 64.0% - 64.5% ] 64.33% | 109,357 | 11.8% |
[ 64.5% - 65.0% ] 64.88% | 105,802 | 18.9% |
[ 65.0% - 65.5% ] 65.10% | 52,687 | 9.5% |
[ 65.5% - 66.0% ] 65.66% | 99 | 18.7% |
[ 66.0% - 66.5% ] 66.17% | 152,851 | 10.9% |
[ 66.5% - 67.0% ] 66.91% | 109,332 | 16.4% |
[ 67.0% - 67.5% ] 67.19% | 128 | 12.8% |
[ 68.5% - 69.0% ] 68.68% | 119,624 | 13.3% |
[ 69.0% - 69.5% ] 69.26% | 90,791 | 19.7% |
[ 69.5% - 70.0% ] 69.58% | 766 | 2.7% |
[ 70.0% - 70.5% ] 70.39% | 115,169 | 14.5% |
[ 70.5% - 71.0% ] 70.79% | 138,182 | 9.3% |
[ 71.0% - 71.5% ] 71.37% | 45,620 | 16.9% |
[ 72.0% - 72.5% ] 72.50% | 160 | 19.1% |
[ 72.5% - 73.0% ] 72.85% | 57,066 | 13.2% |
[ 73.0% - 73.5% ] 73.31% | 29,830 | 27.4% |
[ 73.5% - 74.0% ] 73.75% | 19,399 | 19.8% |
[ 74.0% - 74.5% ] 74.15% | 257,738 | 18.6% |
[ 74.5% - 75.0% ] 74.68% | 46,798 | 13.7% |
[ 75.0% - 75.5% ] 75.10% | 71,088 | 18.2% |
[ 75.5% - 76.0% ] 75.74% | 1,018 | 11.1% |
[ 77.0% - 77.5% ] 77.38% | 84 | 47.1% |
[ 78.0% - 78.5% ] 78.37% | 42,081 | 16.8% |
[ 80.5% - 81.0% ] 80.83% | 240 | 13.0% |
[ 87.5% - 88.0% ] 87.72% | 171 | 39.8% |
[ 88.5% - 89.0% ] 88.65% | 141 | 19.2% |