Immigrants College, Under 1 year
COMPARE
Immigrants
Select to Compare
College, Under 1 year
Immigrants College, Under 1 year
62.5%
COLLEGE, UNDER 1 YEAR
1.7/ 100
METRIC RATING
236th/ 347
METRIC RANK
Immigrants College, Under 1 year Correlation Chart
The statistical analysis conducted on geographies consisting of 577,770,427 people shows a substantial negative correlation between the proportion of Immigrants and percentage of population with at least college, under 1 year education in the United States with a correlation coefficient (R) of -0.587 and weighted average of 62.5%. On average, for every 1% (one percent) increase in Immigrants within a typical geography, there is a decrease of 0.27% in percentage of population with at least college, under 1 year education.
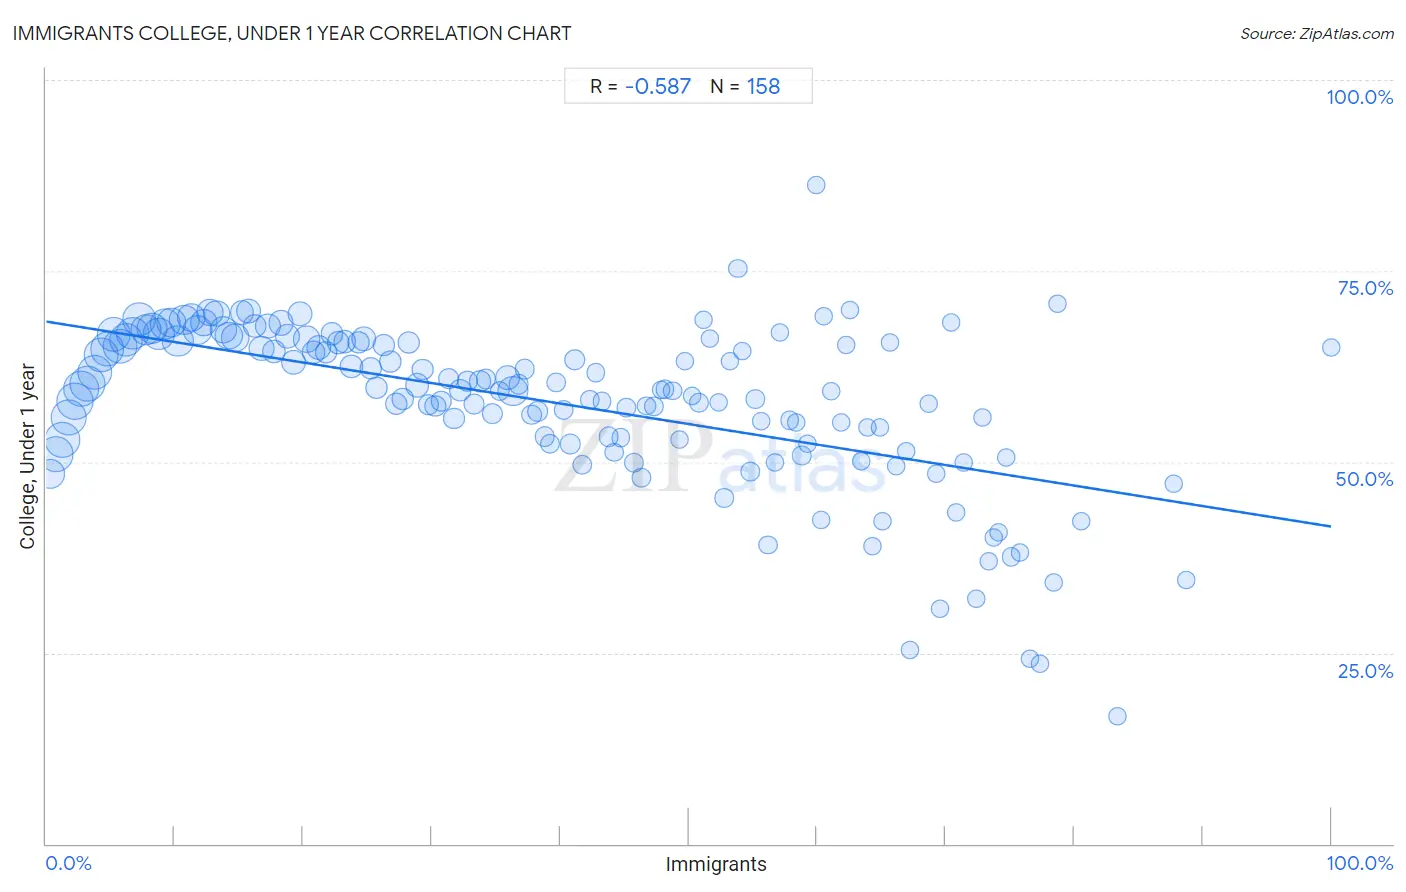
It is essential to understand that the correlation between the percentage of Immigrants and percentage of population with at least college, under 1 year education does not imply a direct cause-and-effect relationship. It remains uncertain whether the presence of Immigrants influences an upward or downward trend in the level of percentage of population with at least college, under 1 year education within an area, or if Immigrants simply ended up residing in those areas with higher or lower levels of percentage of population with at least college, under 1 year education due to other factors.
Demographics Similar to Immigrants by College, Under 1 year
In terms of college, under 1 year, the demographic groups most similar to Immigrants are Immigrants from Burma/Myanmar (62.5%, a difference of 0.030%), French American Indian (62.4%, a difference of 0.12%), Spanish American (62.6%, a difference of 0.13%), Chippewa (62.6%, a difference of 0.18%), and Iroquois (62.6%, a difference of 0.21%).
| Demographics | Rating | Rank | College, Under 1 year |
| Liberians | 3.2 /100 | #229 | Tragic 63.0% |
| Nonimmigrants | 3.0 /100 | #230 | Tragic 62.9% |
| Immigrants from Western Africa | 2.4 /100 | #231 | Tragic 62.8% |
| Osage | 2.2 /100 | #232 | Tragic 62.7% |
| Iroquois | 2.0 /100 | #233 | Tragic 62.6% |
| Chippewa | 2.0 /100 | #234 | Tragic 62.6% |
| Spanish Americans | 1.9 /100 | #235 | Tragic 62.6% |
| Immigrants | 1.7 /100 | #236 | Tragic 62.5% |
| Immigrants from Burma/Myanmar | 1.6 /100 | #237 | Tragic 62.5% |
| French American Indians | 1.5 /100 | #238 | Tragic 62.4% |
| Nepalese | 1.1 /100 | #239 | Tragic 62.2% |
| Aleuts | 1.1 /100 | #240 | Tragic 62.2% |
| Ottawa | 1.1 /100 | #241 | Tragic 62.2% |
| Malaysians | 1.1 /100 | #242 | Tragic 62.2% |
| Hawaiians | 1.1 /100 | #243 | Tragic 62.1% |
Immigrants College, Under 1 year Correlation Summary
| Measurement | Immigrants Data | College, Under 1 year Data |
| Minimum | 0.28% | 16.7% |
| Maximum | 100.0% | 86.3% |
| Range | 99.7% | 69.7% |
| Mean | 40.0% | 57.6% |
| Median | 39.5% | 59.4% |
| Interquartile 25% (IQ1) | 19.7% | 52.9% |
| Interquartile 75% (IQ3) | 59.2% | 65.7% |
| Interquartile Range (IQR) | 39.5% | 12.8% |
| Standard Deviation (Sample) | 23.8% | 10.9% |
| Standard Deviation (Population) | 23.7% | 10.8% |
Correlation Details
| Immigrants Percentile | Sample Size | College, Under 1 year |
[ 0.0% - 0.5% ] 0.28% | 9,797,190 | 48.4% |
[ 0.5% - 1.0% ] 0.76% | 14,931,407 | 51.0% |
[ 1.0% - 1.5% ] 1.25% | 15,920,775 | 52.9% |
[ 1.5% - 2.0% ] 1.75% | 15,767,389 | 55.9% |
[ 2.0% - 2.5% ] 2.24% | 16,773,679 | 58.0% |
[ 2.5% - 3.0% ] 2.74% | 15,771,981 | 59.6% |
[ 3.0% - 3.5% ] 3.24% | 15,757,800 | 60.3% |
[ 3.5% - 4.0% ] 3.75% | 14,927,088 | 61.8% |
[ 4.0% - 4.5% ] 4.25% | 14,680,626 | 64.0% |
[ 4.5% - 5.0% ] 4.75% | 13,965,758 | 64.8% |
[ 5.0% - 5.5% ] 5.26% | 13,517,639 | 66.7% |
[ 5.5% - 6.0% ] 5.75% | 14,510,249 | 65.1% |
[ 6.0% - 6.5% ] 6.24% | 13,733,925 | 66.0% |
[ 6.5% - 7.0% ] 6.75% | 13,115,152 | 66.8% |
[ 7.0% - 7.5% ] 7.24% | 12,668,449 | 68.7% |
[ 7.5% - 8.0% ] 7.74% | 11,631,714 | 67.3% |
[ 8.0% - 8.5% ] 8.23% | 11,979,552 | 67.5% |
[ 8.5% - 9.0% ] 8.74% | 12,117,437 | 66.7% |
[ 9.0% - 9.5% ] 9.25% | 10,812,823 | 68.1% |
[ 9.5% - 10.0% ] 9.76% | 9,929,722 | 68.2% |
[ 10.0% - 10.5% ] 10.26% | 11,706,423 | 65.8% |
[ 10.5% - 11.0% ] 10.74% | 10,269,150 | 68.6% |
[ 11.0% - 11.5% ] 11.24% | 8,920,287 | 69.0% |
[ 11.5% - 12.0% ] 11.76% | 9,987,669 | 67.3% |
[ 12.0% - 12.5% ] 12.22% | 7,663,379 | 68.3% |
[ 12.5% - 13.0% ] 12.75% | 7,961,798 | 69.5% |
[ 13.0% - 13.5% ] 13.25% | 7,152,709 | 69.4% |
[ 13.5% - 14.0% ] 13.80% | 8,319,947 | 67.3% |
[ 14.0% - 14.5% ] 14.24% | 8,825,067 | 66.5% |
[ 14.5% - 15.0% ] 14.73% | 8,595,808 | 66.2% |
[ 15.0% - 15.5% ] 15.23% | 5,444,405 | 69.6% |
[ 15.5% - 16.0% ] 15.77% | 5,921,855 | 69.8% |
[ 16.0% - 16.5% ] 16.23% | 5,021,862 | 67.8% |
[ 16.5% - 17.0% ] 16.74% | 6,104,399 | 64.9% |
[ 17.0% - 17.5% ] 17.25% | 5,954,576 | 67.8% |
[ 17.5% - 18.0% ] 17.70% | 4,134,594 | 64.5% |
[ 18.0% - 18.5% ] 18.25% | 5,999,088 | 68.2% |
[ 18.5% - 19.0% ] 18.78% | 5,665,284 | 66.4% |
[ 19.0% - 19.5% ] 19.26% | 5,949,415 | 63.0% |
[ 19.5% - 20.0% ] 19.74% | 5,480,234 | 69.3% |
[ 20.0% - 20.5% ] 20.27% | 7,111,692 | 66.0% |
[ 20.5% - 21.0% ] 20.77% | 4,834,654 | 64.3% |
[ 21.0% - 21.5% ] 21.23% | 5,562,924 | 64.9% |
[ 21.5% - 22.0% ] 21.77% | 3,717,633 | 64.3% |
[ 22.0% - 22.5% ] 22.23% | 4,428,086 | 66.7% |
[ 22.5% - 23.0% ] 22.73% | 4,307,260 | 65.7% |
[ 23.0% - 23.5% ] 23.24% | 3,757,247 | 65.8% |
[ 23.5% - 24.0% ] 23.76% | 4,204,985 | 62.5% |
[ 24.0% - 24.5% ] 24.28% | 3,615,296 | 65.7% |
[ 24.5% - 25.0% ] 24.75% | 5,524,326 | 66.1% |
[ 25.0% - 25.5% ] 25.25% | 4,178,219 | 62.2% |
[ 25.5% - 26.0% ] 25.69% | 2,919,989 | 59.7% |
[ 26.0% - 26.5% ] 26.24% | 3,199,820 | 65.3% |
[ 26.5% - 27.0% ] 26.76% | 2,756,536 | 63.1% |
[ 27.0% - 27.5% ] 27.27% | 3,319,129 | 57.5% |
[ 27.5% - 28.0% ] 27.73% | 2,979,801 | 58.2% |
[ 28.0% - 28.5% ] 28.24% | 3,349,114 | 65.6% |
[ 28.5% - 29.0% ] 28.86% | 5,113,162 | 60.0% |
[ 29.0% - 29.5% ] 29.27% | 3,120,528 | 62.1% |
[ 29.5% - 30.0% ] 29.76% | 2,779,639 | 57.5% |
[ 30.0% - 30.5% ] 30.27% | 2,702,323 | 57.3% |
[ 30.5% - 31.0% ] 30.74% | 2,241,401 | 58.0% |
[ 31.0% - 31.5% ] 31.31% | 2,414,630 | 60.9% |
[ 31.5% - 32.0% ] 31.75% | 2,833,397 | 55.7% |
[ 32.0% - 32.5% ] 32.21% | 2,889,922 | 59.4% |
[ 32.5% - 33.0% ] 32.75% | 2,370,489 | 60.5% |
[ 33.0% - 33.5% ] 33.27% | 1,734,772 | 57.5% |
[ 33.5% - 34.0% ] 33.74% | 3,250,013 | 60.6% |
[ 34.0% - 34.5% ] 34.23% | 1,749,543 | 60.9% |
[ 34.5% - 35.0% ] 34.74% | 2,390,850 | 56.2% |
[ 35.0% - 35.5% ] 35.26% | 1,587,217 | 59.3% |
[ 35.5% - 36.0% ] 35.91% | 5,381,430 | 61.0% |
[ 36.0% - 36.5% ] 36.32% | 10,447,094 | 59.2% |
[ 36.5% - 37.0% ] 36.77% | 1,322,189 | 60.1% |
[ 37.0% - 37.5% ] 37.26% | 1,598,123 | 62.1% |
[ 37.5% - 38.0% ] 37.76% | 1,537,537 | 56.1% |
[ 38.0% - 38.5% ] 38.23% | 1,934,404 | 56.6% |
[ 38.5% - 39.0% ] 38.81% | 1,612,241 | 53.3% |
[ 39.0% - 39.5% ] 39.23% | 1,154,486 | 52.4% |
[ 39.5% - 40.0% ] 39.69% | 1,209,810 | 60.4% |
[ 40.0% - 40.5% ] 40.25% | 1,249,213 | 56.8% |
[ 40.5% - 41.0% ] 40.76% | 1,733,799 | 52.3% |
[ 41.0% - 41.5% ] 41.11% | 2,638,402 | 63.4% |
[ 41.5% - 42.0% ] 41.73% | 1,525,850 | 49.6% |
[ 42.0% - 42.5% ] 42.28% | 1,501,490 | 58.2% |
[ 42.5% - 43.0% ] 42.78% | 816,283 | 61.7% |
[ 43.0% - 43.5% ] 43.26% | 890,544 | 57.9% |
[ 43.5% - 44.0% ] 43.79% | 1,290,295 | 53.3% |
[ 44.0% - 44.5% ] 44.20% | 369,140 | 51.3% |
[ 44.5% - 45.0% ] 44.72% | 858,656 | 53.2% |
[ 45.0% - 45.5% ] 45.14% | 871,806 | 57.2% |
[ 45.5% - 46.0% ] 45.75% | 710,208 | 49.9% |
[ 46.0% - 46.5% ] 46.30% | 775,976 | 48.0% |
[ 46.5% - 47.0% ] 46.72% | 708,226 | 57.3% |
[ 47.0% - 47.5% ] 47.30% | 841,303 | 57.3% |
[ 47.5% - 48.0% ] 47.83% | 277,561 | 59.4% |
[ 48.0% - 48.5% ] 48.14% | 169,799 | 59.5% |
[ 48.5% - 49.0% ] 48.74% | 845,794 | 59.3% |
[ 49.0% - 49.5% ] 49.28% | 847,337 | 52.9% |
[ 49.5% - 50.0% ] 49.69% | 166,058 | 63.1% |
[ 50.0% - 50.5% ] 50.28% | 640,490 | 58.6% |
[ 50.5% - 51.0% ] 50.79% | 730,765 | 57.8% |
[ 51.0% - 51.5% ] 51.18% | 322,007 | 68.6% |
[ 51.5% - 52.0% ] 51.67% | 305,963 | 66.1% |
[ 52.0% - 52.5% ] 52.32% | 205,023 | 57.8% |
[ 52.5% - 53.0% ] 52.76% | 236,458 | 45.3% |
[ 53.0% - 53.5% ] 53.23% | 137,110 | 63.2% |
[ 53.5% - 54.0% ] 53.81% | 463,502 | 75.3% |
[ 54.0% - 54.5% ] 54.17% | 375,384 | 64.5% |
[ 54.5% - 55.0% ] 54.78% | 593,729 | 48.7% |
[ 55.0% - 55.5% ] 55.18% | 482,758 | 58.2% |
[ 55.5% - 56.0% ] 55.61% | 148,608 | 55.3% |
[ 56.0% - 56.5% ] 56.17% | 91,519 | 39.1% |
[ 56.5% - 57.0% ] 56.72% | 75,873 | 49.9% |
[ 57.0% - 57.5% ] 57.13% | 110,585 | 67.0% |
[ 57.5% - 58.0% ] 57.84% | 598,269 | 55.4% |
[ 58.0% - 58.5% ] 58.34% | 98,125 | 55.1% |
[ 58.5% - 59.0% ] 58.80% | 221,497 | 50.8% |
[ 59.0% - 59.5% ] 59.19% | 87,048 | 52.4% |
[ 59.5% - 60.0% ] 59.92% | 15,887 | 86.3% |
[ 60.0% - 60.5% ] 60.30% | 154,064 | 42.4% |
[ 60.5% - 61.0% ] 60.53% | 36,392 | 69.1% |
[ 61.0% - 61.5% ] 61.13% | 58,079 | 59.2% |
[ 61.5% - 62.0% ] 61.88% | 128,910 | 55.2% |
[ 62.0% - 62.5% ] 62.28% | 94,247 | 65.3% |
[ 62.5% - 63.0% ] 62.58% | 26,268 | 69.9% |
[ 63.0% - 63.5% ] 63.42% | 26,861 | 50.1% |
[ 63.5% - 64.0% ] 63.90% | 117,893 | 54.5% |
[ 64.0% - 64.5% ] 64.33% | 109,357 | 39.0% |
[ 64.5% - 65.0% ] 64.88% | 105,802 | 54.6% |
[ 65.0% - 65.5% ] 65.10% | 53,206 | 42.3% |
[ 65.5% - 66.0% ] 65.66% | 99 | 65.7% |
[ 66.0% - 66.5% ] 66.17% | 153,024 | 49.4% |
[ 66.5% - 67.0% ] 66.91% | 109,332 | 51.5% |
[ 67.0% - 67.5% ] 67.23% | 177 | 25.3% |
[ 68.5% - 69.0% ] 68.68% | 119,624 | 57.7% |
[ 69.0% - 69.5% ] 69.26% | 90,791 | 48.5% |
[ 69.5% - 70.0% ] 69.58% | 766 | 30.7% |
[ 70.0% - 70.5% ] 70.39% | 115,169 | 68.3% |
[ 70.5% - 71.0% ] 70.79% | 138,182 | 43.3% |
[ 71.0% - 71.5% ] 71.37% | 45,620 | 49.9% |
[ 72.0% - 72.5% ] 72.38% | 449 | 32.1% |
[ 72.5% - 73.0% ] 72.85% | 57,066 | 55.8% |
[ 73.0% - 73.5% ] 73.31% | 29,830 | 37.0% |
[ 73.5% - 74.0% ] 73.75% | 19,399 | 40.1% |
[ 74.0% - 74.5% ] 74.15% | 257,769 | 40.7% |
[ 74.5% - 75.0% ] 74.68% | 46,798 | 50.6% |
[ 75.0% - 75.5% ] 75.10% | 71,088 | 37.6% |
[ 75.5% - 76.0% ] 75.74% | 1,018 | 38.2% |
[ 76.5% - 77.0% ] 76.52% | 558 | 24.2% |
[ 77.0% - 77.5% ] 77.38% | 84 | 23.5% |
[ 78.0% - 78.5% ] 78.37% | 42,178 | 34.2% |
[ 78.5% - 79.0% ] 78.67% | 211 | 70.6% |
[ 80.5% - 81.0% ] 80.58% | 1,030 | 42.2% |
[ 83.0% - 83.5% ] 83.33% | 72 | 16.7% |
[ 87.5% - 88.0% ] 87.72% | 171 | 47.1% |
[ 88.5% - 89.0% ] 88.69% | 168 | 34.5% |
[ 99.5% - 100.0% ] 100.00% | 120 | 65.0% |