Immigrants Disability
COMPARE
Immigrants
Select to Compare
Disability
Immigrants Disability
11.3%
DISABILITY
96.4/ 100
METRIC RATING
104th/ 347
METRIC RANK
Immigrants Disability Correlation Chart
The statistical analysis conducted on geographies consisting of 577,602,832 people shows a poor negative correlation between the proportion of Immigrants and percentage of population with a disability in the United States with a correlation coefficient (R) of -0.154 and weighted average of 11.3%. On average, for every 1% (one percent) increase in Immigrants within a typical geography, there is a decrease of 0.027% in percentage of population with a disability.
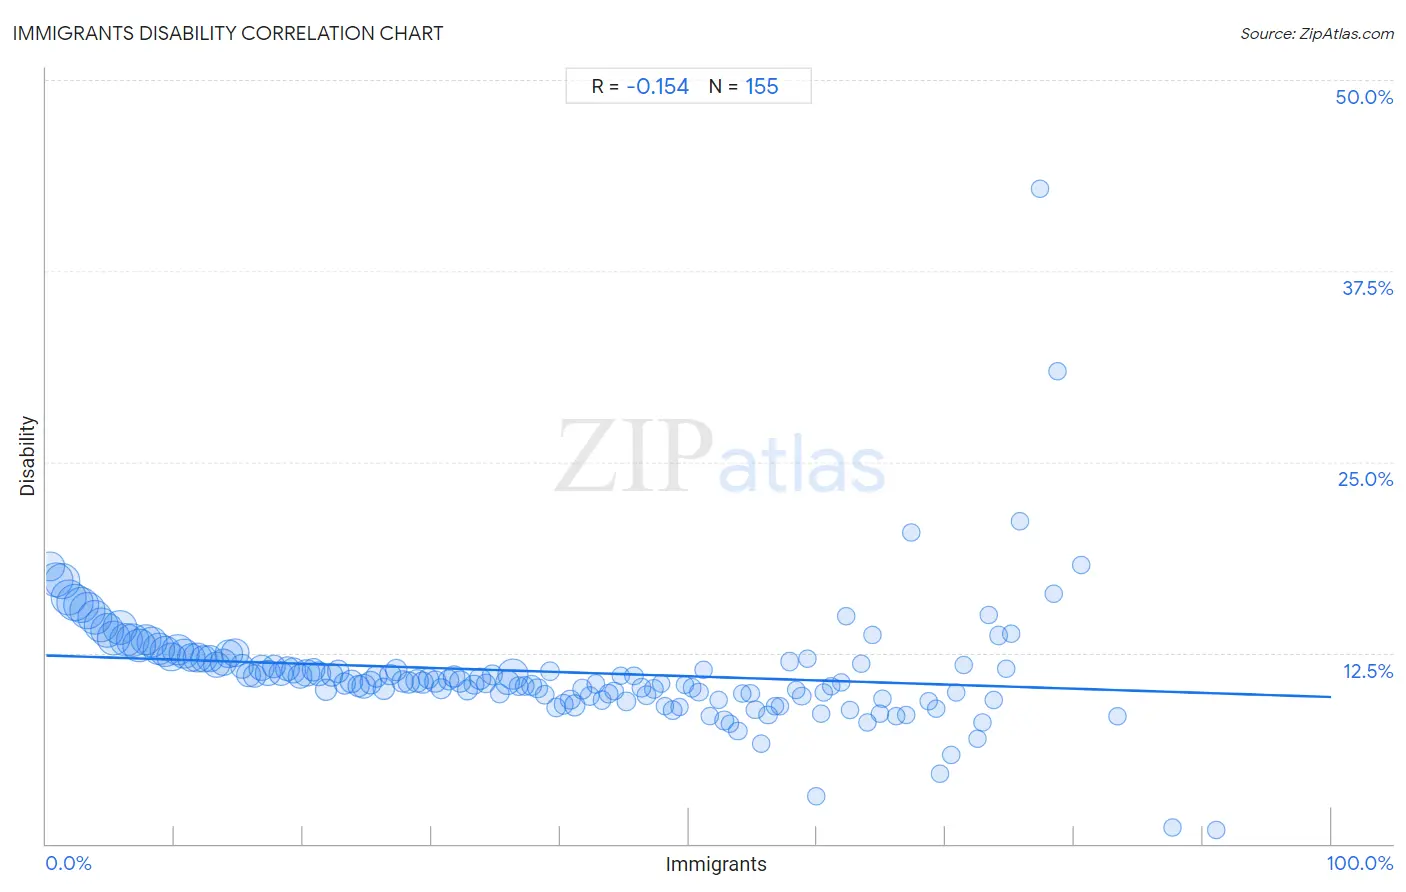
It is essential to understand that the correlation between the percentage of Immigrants and percentage of population with a disability does not imply a direct cause-and-effect relationship. It remains uncertain whether the presence of Immigrants influences an upward or downward trend in the level of percentage of population with a disability within an area, or if Immigrants simply ended up residing in those areas with higher or lower levels of percentage of population with a disability due to other factors.
Demographics Similar to Immigrants by Disability
In terms of disability, the demographic groups most similar to Immigrants are Immigrants from Uruguay (11.3%, a difference of 0.010%), Immigrants from Kazakhstan (11.3%, a difference of 0.010%), Immigrants from Eastern Europe (11.3%, a difference of 0.040%), Nicaraguan (11.3%, a difference of 0.060%), and Immigrants from Eastern Africa (11.3%, a difference of 0.080%).
| Demographics | Rating | Rank | Disability |
| Bhutanese | 97.4 /100 | #97 | Exceptional 11.2% |
| Uruguayans | 97.4 /100 | #98 | Exceptional 11.2% |
| Immigrants from Czechoslovakia | 97.4 /100 | #99 | Exceptional 11.2% |
| Immigrants from Greece | 96.9 /100 | #100 | Exceptional 11.3% |
| Immigrants from Nicaragua | 96.8 /100 | #101 | Exceptional 11.3% |
| Immigrants from Eastern Africa | 96.7 /100 | #102 | Exceptional 11.3% |
| Immigrants from Uruguay | 96.4 /100 | #103 | Exceptional 11.3% |
| Immigrants | 96.4 /100 | #104 | Exceptional 11.3% |
| Immigrants from Kazakhstan | 96.4 /100 | #105 | Exceptional 11.3% |
| Immigrants from Eastern Europe | 96.3 /100 | #106 | Exceptional 11.3% |
| Nicaraguans | 96.2 /100 | #107 | Exceptional 11.3% |
| Immigrants from Nigeria | 96.0 /100 | #108 | Exceptional 11.3% |
| Immigrants from Uganda | 95.7 /100 | #109 | Exceptional 11.3% |
| Immigrants from Denmark | 95.6 /100 | #110 | Exceptional 11.3% |
| Immigrants from South Eastern Asia | 95.4 /100 | #111 | Exceptional 11.3% |
Immigrants Disability Correlation Summary
| Measurement | Immigrants Data | Disability Data |
| Minimum | 0.28% | 0.89% |
| Maximum | 91.1% | 42.9% |
| Range | 90.8% | 42.0% |
| Mean | 39.2% | 11.3% |
| Median | 38.8% | 10.6% |
| Interquartile 25% (IQ1) | 19.3% | 9.7% |
| Interquartile 75% (IQ3) | 58.3% | 12.1% |
| Interquartile Range (IQR) | 39.1% | 2.4% |
| Standard Deviation (Sample) | 23.2% | 4.1% |
| Standard Deviation (Population) | 23.2% | 4.1% |
Correlation Details
| Immigrants Percentile | Sample Size | Disability |
[ 0.0% - 0.5% ] 0.28% | 9,796,039 | 18.2% |
[ 0.5% - 1.0% ] 0.76% | 14,927,345 | 17.3% |
[ 1.0% - 1.5% ] 1.25% | 15,921,405 | 17.2% |
[ 1.5% - 2.0% ] 1.75% | 15,761,596 | 16.2% |
[ 2.0% - 2.5% ] 2.24% | 16,767,544 | 15.8% |
[ 2.5% - 3.0% ] 2.74% | 15,767,342 | 15.6% |
[ 3.0% - 3.5% ] 3.24% | 15,748,770 | 15.3% |
[ 3.5% - 4.0% ] 3.75% | 14,916,174 | 14.8% |
[ 4.0% - 4.5% ] 4.25% | 14,673,739 | 14.3% |
[ 4.5% - 5.0% ] 4.75% | 13,943,211 | 14.0% |
[ 5.0% - 5.5% ] 5.26% | 13,516,334 | 13.5% |
[ 5.5% - 6.0% ] 5.75% | 14,498,370 | 14.1% |
[ 6.0% - 6.5% ] 6.24% | 13,731,531 | 13.3% |
[ 6.5% - 7.0% ] 6.75% | 13,110,616 | 13.4% |
[ 7.0% - 7.5% ] 7.24% | 12,663,894 | 13.0% |
[ 7.5% - 8.0% ] 7.74% | 11,626,661 | 13.3% |
[ 8.0% - 8.5% ] 8.23% | 11,975,148 | 13.2% |
[ 8.5% - 9.0% ] 8.74% | 12,116,836 | 12.8% |
[ 9.0% - 9.5% ] 9.25% | 10,801,991 | 12.6% |
[ 9.5% - 10.0% ] 9.76% | 9,914,761 | 12.2% |
[ 10.0% - 10.5% ] 10.26% | 11,700,142 | 12.7% |
[ 10.5% - 11.0% ] 10.74% | 10,266,072 | 12.5% |
[ 11.0% - 11.5% ] 11.24% | 8,921,651 | 12.2% |
[ 11.5% - 12.0% ] 11.76% | 9,982,570 | 12.2% |
[ 12.0% - 12.5% ] 12.22% | 7,666,256 | 12.1% |
[ 12.5% - 13.0% ] 12.75% | 7,965,651 | 12.1% |
[ 13.0% - 13.5% ] 13.25% | 7,150,524 | 11.7% |
[ 13.5% - 14.0% ] 13.80% | 8,319,046 | 11.9% |
[ 14.0% - 14.5% ] 14.24% | 8,827,389 | 12.5% |
[ 14.5% - 15.0% ] 14.73% | 8,592,137 | 12.5% |
[ 15.0% - 15.5% ] 15.23% | 5,444,677 | 11.6% |
[ 15.5% - 16.0% ] 15.77% | 5,918,425 | 11.1% |
[ 16.0% - 16.5% ] 16.23% | 5,020,427 | 11.0% |
[ 16.5% - 17.0% ] 16.74% | 6,104,060 | 11.5% |
[ 17.0% - 17.5% ] 17.25% | 5,954,403 | 11.2% |
[ 17.5% - 18.0% ] 17.70% | 4,133,845 | 11.6% |
[ 18.0% - 18.5% ] 18.25% | 5,999,033 | 11.1% |
[ 18.5% - 19.0% ] 18.78% | 5,664,804 | 11.5% |
[ 19.0% - 19.5% ] 19.26% | 5,949,172 | 11.4% |
[ 19.5% - 20.0% ] 19.74% | 5,475,287 | 10.9% |
[ 20.0% - 20.5% ] 20.27% | 7,111,691 | 11.2% |
[ 20.5% - 21.0% ] 20.77% | 4,834,353 | 11.4% |
[ 21.0% - 21.5% ] 21.23% | 5,562,043 | 11.1% |
[ 21.5% - 22.0% ] 21.77% | 3,716,936 | 10.1% |
[ 22.0% - 22.5% ] 22.23% | 4,427,646 | 11.1% |
[ 22.5% - 23.0% ] 22.73% | 4,305,206 | 11.3% |
[ 23.0% - 23.5% ] 23.24% | 3,756,670 | 10.5% |
[ 23.5% - 24.0% ] 23.76% | 4,203,326 | 10.6% |
[ 24.0% - 24.5% ] 24.28% | 3,614,130 | 10.3% |
[ 24.5% - 25.0% ] 24.75% | 5,524,495 | 10.3% |
[ 25.0% - 25.5% ] 25.25% | 4,177,762 | 10.6% |
[ 25.5% - 26.0% ] 25.69% | 2,919,989 | 11.0% |
[ 26.0% - 26.5% ] 26.24% | 3,199,599 | 10.1% |
[ 26.5% - 27.0% ] 26.76% | 2,755,951 | 11.0% |
[ 27.0% - 27.5% ] 27.27% | 3,319,044 | 11.4% |
[ 27.5% - 28.0% ] 27.73% | 2,979,729 | 10.6% |
[ 28.0% - 28.5% ] 28.24% | 3,348,516 | 10.6% |
[ 28.5% - 29.0% ] 28.86% | 5,113,354 | 10.7% |
[ 29.0% - 29.5% ] 29.27% | 3,120,684 | 10.5% |
[ 29.5% - 30.0% ] 29.76% | 2,779,612 | 10.8% |
[ 30.0% - 30.5% ] 30.27% | 2,702,277 | 10.6% |
[ 30.5% - 31.0% ] 30.74% | 2,240,738 | 10.2% |
[ 31.0% - 31.5% ] 31.31% | 2,414,492 | 10.7% |
[ 31.5% - 32.0% ] 31.75% | 2,833,491 | 11.0% |
[ 32.0% - 32.5% ] 32.21% | 2,889,655 | 10.6% |
[ 32.5% - 33.0% ] 32.75% | 2,370,489 | 10.1% |
[ 33.0% - 33.5% ] 33.27% | 1,734,769 | 10.4% |
[ 33.5% - 34.0% ] 33.74% | 3,249,951 | 10.8% |
[ 34.0% - 34.5% ] 34.23% | 1,749,196 | 10.5% |
[ 34.5% - 35.0% ] 34.74% | 2,390,314 | 11.0% |
[ 35.0% - 35.5% ] 35.26% | 1,587,007 | 9.8% |
[ 35.5% - 36.0% ] 35.91% | 5,381,430 | 10.6% |
[ 36.0% - 36.5% ] 36.32% | 10,447,094 | 11.1% |
[ 36.5% - 37.0% ] 36.77% | 1,322,140 | 10.3% |
[ 37.0% - 37.5% ] 37.26% | 1,598,067 | 10.3% |
[ 37.5% - 38.0% ] 37.76% | 1,537,537 | 10.4% |
[ 38.0% - 38.5% ] 38.23% | 1,934,404 | 10.2% |
[ 38.5% - 39.0% ] 38.81% | 1,611,983 | 9.8% |
[ 39.0% - 39.5% ] 39.23% | 1,154,338 | 11.3% |
[ 39.5% - 40.0% ] 39.69% | 1,209,903 | 8.9% |
[ 40.0% - 40.5% ] 40.25% | 1,249,653 | 9.1% |
[ 40.5% - 41.0% ] 40.76% | 1,733,718 | 9.4% |
[ 41.0% - 41.5% ] 41.11% | 2,639,001 | 9.1% |
[ 41.5% - 42.0% ] 41.73% | 1,525,927 | 10.1% |
[ 42.0% - 42.5% ] 42.28% | 1,501,490 | 9.6% |
[ 42.5% - 43.0% ] 42.78% | 816,236 | 10.4% |
[ 43.0% - 43.5% ] 43.26% | 890,451 | 9.4% |
[ 43.5% - 44.0% ] 43.79% | 1,289,971 | 9.8% |
[ 44.0% - 44.5% ] 44.20% | 369,140 | 10.0% |
[ 44.5% - 45.0% ] 44.72% | 858,656 | 11.0% |
[ 45.0% - 45.5% ] 45.14% | 871,806 | 9.3% |
[ 45.5% - 46.0% ] 45.75% | 710,381 | 11.0% |
[ 46.0% - 46.5% ] 46.30% | 775,976 | 10.2% |
[ 46.5% - 47.0% ] 46.72% | 708,226 | 9.7% |
[ 47.0% - 47.5% ] 47.30% | 841,320 | 10.1% |
[ 47.5% - 48.0% ] 47.83% | 277,561 | 10.5% |
[ 48.0% - 48.5% ] 48.14% | 169,549 | 9.0% |
[ 48.5% - 49.0% ] 48.74% | 845,868 | 8.7% |
[ 49.0% - 49.5% ] 49.28% | 847,337 | 8.9% |
[ 49.5% - 50.0% ] 49.69% | 166,000 | 10.4% |
[ 50.0% - 50.5% ] 50.28% | 640,490 | 10.2% |
[ 50.5% - 51.0% ] 50.79% | 730,592 | 9.9% |
[ 51.0% - 51.5% ] 51.18% | 322,007 | 11.4% |
[ 51.5% - 52.0% ] 51.67% | 305,963 | 8.4% |
[ 52.0% - 52.5% ] 52.32% | 205,023 | 9.4% |
[ 52.5% - 53.0% ] 52.76% | 236,458 | 8.1% |
[ 53.0% - 53.5% ] 53.23% | 137,110 | 7.9% |
[ 53.5% - 54.0% ] 53.81% | 463,502 | 7.4% |
[ 54.0% - 54.5% ] 54.17% | 374,845 | 9.8% |
[ 54.5% - 55.0% ] 54.78% | 593,718 | 9.8% |
[ 55.0% - 55.5% ] 55.18% | 482,758 | 8.8% |
[ 55.5% - 56.0% ] 55.61% | 148,289 | 6.6% |
[ 56.0% - 56.5% ] 56.17% | 91,519 | 8.5% |
[ 56.5% - 57.0% ] 56.72% | 75,873 | 9.0% |
[ 57.0% - 57.5% ] 57.13% | 110,508 | 9.0% |
[ 57.5% - 58.0% ] 57.84% | 598,156 | 11.9% |
[ 58.0% - 58.5% ] 58.34% | 98,125 | 10.0% |
[ 58.5% - 59.0% ] 58.80% | 221,458 | 9.7% |
[ 59.0% - 59.5% ] 59.19% | 87,048 | 12.1% |
[ 59.5% - 60.0% ] 59.92% | 15,969 | 3.1% |
[ 60.0% - 60.5% ] 60.30% | 154,064 | 8.5% |
[ 60.5% - 61.0% ] 60.53% | 36,392 | 9.9% |
[ 61.0% - 61.5% ] 61.13% | 58,079 | 10.3% |
[ 61.5% - 62.0% ] 61.88% | 128,876 | 10.6% |
[ 62.0% - 62.5% ] 62.28% | 94,284 | 14.9% |
[ 62.5% - 63.0% ] 62.58% | 26,090 | 8.7% |
[ 63.0% - 63.5% ] 63.42% | 26,861 | 11.8% |
[ 63.5% - 64.0% ] 63.90% | 117,893 | 7.9% |
[ 64.0% - 64.5% ] 64.33% | 109,357 | 13.7% |
[ 64.5% - 65.0% ] 64.88% | 105,802 | 8.5% |
[ 65.0% - 65.5% ] 65.10% | 53,206 | 9.5% |
[ 66.0% - 66.5% ] 66.17% | 153,024 | 8.3% |
[ 66.5% - 67.0% ] 66.91% | 109,332 | 8.4% |
[ 67.0% - 67.5% ] 67.35% | 49 | 20.4% |
[ 68.5% - 69.0% ] 68.68% | 119,624 | 9.3% |
[ 69.0% - 69.5% ] 69.26% | 90,791 | 8.8% |
[ 69.5% - 70.0% ] 69.58% | 766 | 4.6% |
[ 70.0% - 70.5% ] 70.39% | 115,169 | 5.8% |
[ 70.5% - 71.0% ] 70.79% | 138,182 | 9.9% |
[ 71.0% - 71.5% ] 71.37% | 45,620 | 11.7% |
[ 72.0% - 72.5% ] 72.50% | 160 | 6.9% |
[ 72.5% - 73.0% ] 72.85% | 57,066 | 8.0% |
[ 73.0% - 73.5% ] 73.31% | 29,830 | 14.9% |
[ 73.5% - 74.0% ] 73.75% | 19,452 | 9.4% |
[ 74.0% - 74.5% ] 74.15% | 257,738 | 13.6% |
[ 74.5% - 75.0% ] 74.68% | 46,798 | 11.5% |
[ 75.0% - 75.5% ] 75.10% | 71,088 | 13.7% |
[ 75.5% - 76.0% ] 75.74% | 1,018 | 21.1% |
[ 77.0% - 77.5% ] 77.38% | 84 | 42.9% |
[ 78.0% - 78.5% ] 78.37% | 42,081 | 16.3% |
[ 78.5% - 79.0% ] 78.65% | 178 | 30.9% |
[ 80.5% - 81.0% ] 80.58% | 1,030 | 18.2% |
[ 83.0% - 83.5% ] 83.33% | 72 | 8.3% |
[ 87.5% - 88.0% ] 87.63% | 97 | 1.0% |
[ 91.0% - 91.5% ] 91.07% | 112 | 0.89% |