Immigrants 4 or more Vehicles in Household
COMPARE
Immigrants
Select to Compare
4 or more Vehicles in Household
Immigrants 4 or more Vehicles in Household
6.8%
4+ VEHICLES AVAILABLE
94.6/ 100
METRIC RATING
123rd/ 347
METRIC RANK
Immigrants 4 or more Vehicles in Household Correlation Chart
The statistical analysis conducted on geographies consisting of 573,807,662 people shows a mild negative correlation between the proportion of Immigrants and percentage of households with 4 or more vehicles available in the United States with a correlation coefficient (R) of -0.358 and weighted average of 6.8%. On average, for every 1% (one percent) increase in Immigrants within a typical geography, there is a decrease of 0.040% in percentage of households with 4 or more vehicles available.
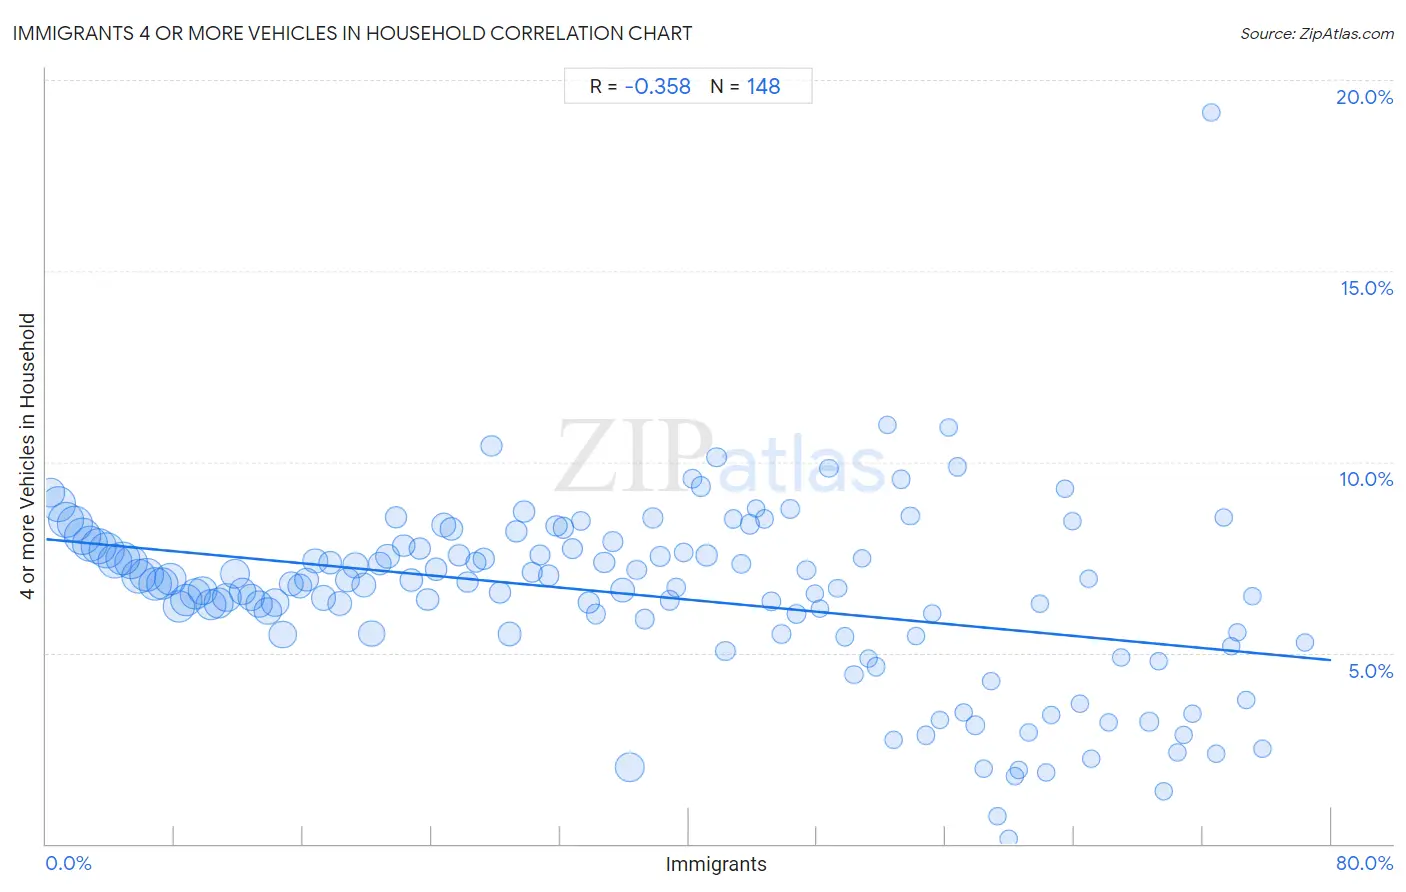
It is essential to understand that the correlation between the percentage of Immigrants and percentage of households with 4 or more vehicles available does not imply a direct cause-and-effect relationship. It remains uncertain whether the presence of Immigrants influences an upward or downward trend in the level of percentage of households with 4 or more vehicles available within an area, or if Immigrants simply ended up residing in those areas with higher or lower levels of percentage of households with 4 or more vehicles available due to other factors.
Demographics Similar to Immigrants by 4 or more Vehicles in Household
In terms of 4 or more vehicles in household, the demographic groups most similar to Immigrants are Immigrants from Nicaragua (6.8%, a difference of 0.060%), Immigrants from Germany (6.8%, a difference of 0.070%), Immigrants from Asia (6.8%, a difference of 0.10%), Comanche (6.8%, a difference of 0.13%), and Austrian (6.8%, a difference of 0.19%).
| Demographics | Rating | Rank | 4 or more Vehicles in Household |
| Immigrants from Guatemala | 95.8 /100 | #116 | Exceptional 6.8% |
| Burmese | 95.7 /100 | #117 | Exceptional 6.8% |
| French American Indians | 95.7 /100 | #118 | Exceptional 6.8% |
| Costa Ricans | 95.5 /100 | #119 | Exceptional 6.8% |
| Comanche | 94.8 /100 | #120 | Exceptional 6.8% |
| Immigrants from Germany | 94.7 /100 | #121 | Exceptional 6.8% |
| Immigrants from Nicaragua | 94.7 /100 | #122 | Exceptional 6.8% |
| Immigrants | 94.6 /100 | #123 | Exceptional 6.8% |
| Immigrants from Asia | 94.4 /100 | #124 | Exceptional 6.8% |
| Austrians | 94.1 /100 | #125 | Exceptional 6.8% |
| Belgians | 94.1 /100 | #126 | Exceptional 6.8% |
| Immigrants from Korea | 93.8 /100 | #127 | Exceptional 6.8% |
| Immigrants from Bolivia | 92.5 /100 | #128 | Exceptional 6.7% |
| Immigrants from England | 92.0 /100 | #129 | Exceptional 6.7% |
| Immigrants from Scotland | 89.0 /100 | #130 | Excellent 6.7% |
Immigrants 4 or more Vehicles in Household Correlation Summary
| Measurement | Immigrants Data | 4 or more Vehicles in Household Data |
| Minimum | 0.28% | 0.13% |
| Maximum | 78.4% | 19.1% |
| Range | 78.1% | 19.0% |
| Mean | 37.3% | 6.5% |
| Median | 37.0% | 6.8% |
| Interquartile 25% (IQ1) | 18.5% | 5.5% |
| Interquartile 75% (IQ3) | 55.4% | 7.8% |
| Interquartile Range (IQR) | 36.9% | 2.3% |
| Standard Deviation (Sample) | 21.8% | 2.4% |
| Standard Deviation (Population) | 21.8% | 2.4% |
Correlation Details
| Immigrants Percentile | Sample Size | 4 or more Vehicles in Household |
[ 0.0% - 0.5% ] 0.28% | 9,697,958 | 9.2% |
[ 0.5% - 1.0% ] 0.76% | 14,847,009 | 8.9% |
[ 1.0% - 1.5% ] 1.25% | 15,832,750 | 8.5% |
[ 1.5% - 2.0% ] 1.75% | 15,666,921 | 8.4% |
[ 2.0% - 2.5% ] 2.24% | 16,633,826 | 8.1% |
[ 2.5% - 3.0% ] 2.74% | 15,644,710 | 7.9% |
[ 3.0% - 3.5% ] 3.24% | 15,655,732 | 7.8% |
[ 3.5% - 4.0% ] 3.75% | 14,840,986 | 7.7% |
[ 4.0% - 4.5% ] 4.25% | 14,610,462 | 7.4% |
[ 4.5% - 5.0% ] 4.75% | 13,859,390 | 7.5% |
[ 5.0% - 5.5% ] 5.26% | 13,429,832 | 7.4% |
[ 5.5% - 6.0% ] 5.75% | 14,436,624 | 7.0% |
[ 6.0% - 6.5% ] 6.24% | 13,645,192 | 7.0% |
[ 6.5% - 7.0% ] 6.75% | 13,065,825 | 6.8% |
[ 7.0% - 7.5% ] 7.24% | 12,574,810 | 6.8% |
[ 7.5% - 8.0% ] 7.74% | 11,566,157 | 6.9% |
[ 8.0% - 8.5% ] 8.23% | 11,897,277 | 6.2% |
[ 8.5% - 9.0% ] 8.74% | 12,090,941 | 6.4% |
[ 9.0% - 9.5% ] 9.25% | 10,745,078 | 6.5% |
[ 9.5% - 10.0% ] 9.76% | 9,845,440 | 6.6% |
[ 10.0% - 10.5% ] 10.26% | 11,665,772 | 6.3% |
[ 10.5% - 11.0% ] 10.74% | 10,203,606 | 6.3% |
[ 11.0% - 11.5% ] 11.24% | 8,906,817 | 6.5% |
[ 11.5% - 12.0% ] 11.76% | 9,947,913 | 7.1% |
[ 12.0% - 12.5% ] 12.22% | 7,637,353 | 6.6% |
[ 12.5% - 13.0% ] 12.75% | 7,894,047 | 6.5% |
[ 13.0% - 13.5% ] 13.25% | 7,134,850 | 6.3% |
[ 13.5% - 14.0% ] 13.80% | 8,279,092 | 6.1% |
[ 14.0% - 14.5% ] 14.24% | 8,762,220 | 6.3% |
[ 14.5% - 15.0% ] 14.73% | 8,535,156 | 5.5% |
[ 15.0% - 15.5% ] 15.23% | 5,414,989 | 6.8% |
[ 15.5% - 16.0% ] 15.77% | 5,910,727 | 6.7% |
[ 16.0% - 16.5% ] 16.22% | 4,942,558 | 6.9% |
[ 16.5% - 17.0% ] 16.74% | 6,061,614 | 7.4% |
[ 17.0% - 17.5% ] 17.25% | 5,939,796 | 6.4% |
[ 17.5% - 18.0% ] 17.70% | 4,120,040 | 7.4% |
[ 18.0% - 18.5% ] 18.25% | 5,987,372 | 6.3% |
[ 18.5% - 19.0% ] 18.78% | 5,605,266 | 6.9% |
[ 19.0% - 19.5% ] 19.26% | 5,937,308 | 7.3% |
[ 19.5% - 20.0% ] 19.74% | 5,450,431 | 6.8% |
[ 20.0% - 20.5% ] 20.27% | 6,988,834 | 5.5% |
[ 20.5% - 21.0% ] 20.77% | 4,809,742 | 7.3% |
[ 21.0% - 21.5% ] 21.23% | 5,482,233 | 7.5% |
[ 21.5% - 22.0% ] 21.77% | 3,701,740 | 8.5% |
[ 22.0% - 22.5% ] 22.23% | 4,414,366 | 7.8% |
[ 22.5% - 23.0% ] 22.73% | 4,305,206 | 6.9% |
[ 23.0% - 23.5% ] 23.24% | 3,725,179 | 7.7% |
[ 23.5% - 24.0% ] 23.76% | 4,180,099 | 6.4% |
[ 24.0% - 24.5% ] 24.28% | 3,576,432 | 7.2% |
[ 24.5% - 25.0% ] 24.75% | 5,516,649 | 8.3% |
[ 25.0% - 25.5% ] 25.25% | 4,164,166 | 8.2% |
[ 25.5% - 26.0% ] 25.69% | 2,847,003 | 7.5% |
[ 26.0% - 26.5% ] 26.24% | 3,141,654 | 6.9% |
[ 26.5% - 27.0% ] 26.76% | 2,736,334 | 7.4% |
[ 27.0% - 27.5% ] 27.27% | 3,265,017 | 7.4% |
[ 27.5% - 28.0% ] 27.73% | 2,855,566 | 10.4% |
[ 28.0% - 28.5% ] 28.23% | 3,335,859 | 6.6% |
[ 28.5% - 29.0% ] 28.86% | 5,074,370 | 5.5% |
[ 29.0% - 29.5% ] 29.27% | 3,111,531 | 8.2% |
[ 29.5% - 30.0% ] 29.76% | 2,774,598 | 8.7% |
[ 30.0% - 30.5% ] 30.27% | 2,687,441 | 7.1% |
[ 30.5% - 31.0% ] 30.74% | 2,207,234 | 7.6% |
[ 31.0% - 31.5% ] 31.31% | 2,378,301 | 7.0% |
[ 31.5% - 32.0% ] 31.75% | 2,831,216 | 8.3% |
[ 32.0% - 32.5% ] 32.21% | 2,871,736 | 8.3% |
[ 32.5% - 33.0% ] 32.75% | 2,369,398 | 7.7% |
[ 33.0% - 33.5% ] 33.27% | 1,687,378 | 8.4% |
[ 33.5% - 34.0% ] 33.74% | 3,245,991 | 6.3% |
[ 34.0% - 34.5% ] 34.23% | 1,745,014 | 6.0% |
[ 34.5% - 35.0% ] 34.74% | 2,386,191 | 7.4% |
[ 35.0% - 35.5% ] 35.26% | 1,580,590 | 7.9% |
[ 35.5% - 36.0% ] 35.91% | 5,349,484 | 6.6% |
[ 36.0% - 36.5% ] 36.32% | 10,444,950 | 2.0% |
[ 36.5% - 37.0% ] 36.77% | 1,310,073 | 7.2% |
[ 37.0% - 37.5% ] 37.26% | 1,596,392 | 5.9% |
[ 37.5% - 38.0% ] 37.76% | 1,505,252 | 8.5% |
[ 38.0% - 38.5% ] 38.23% | 1,932,180 | 7.5% |
[ 38.5% - 39.0% ] 38.81% | 1,593,163 | 6.4% |
[ 39.0% - 39.5% ] 39.23% | 1,154,053 | 6.7% |
[ 39.5% - 40.0% ] 39.69% | 1,201,948 | 7.6% |
[ 40.0% - 40.5% ] 40.25% | 1,227,517 | 9.6% |
[ 40.5% - 41.0% ] 40.76% | 1,727,995 | 9.4% |
[ 41.0% - 41.5% ] 41.11% | 2,637,992 | 7.6% |
[ 41.5% - 42.0% ] 41.73% | 1,524,818 | 10.1% |
[ 42.0% - 42.5% ] 42.28% | 1,499,880 | 5.0% |
[ 42.5% - 43.0% ] 42.77% | 747,059 | 8.5% |
[ 43.0% - 43.5% ] 43.26% | 888,641 | 7.3% |
[ 43.5% - 44.0% ] 43.79% | 1,289,935 | 8.4% |
[ 44.0% - 44.5% ] 44.20% | 367,830 | 8.8% |
[ 44.5% - 45.0% ] 44.72% | 854,794 | 8.5% |
[ 45.0% - 45.5% ] 45.14% | 870,700 | 6.4% |
[ 45.5% - 46.0% ] 45.76% | 612,049 | 5.5% |
[ 46.0% - 46.5% ] 46.31% | 693,943 | 8.8% |
[ 46.5% - 47.0% ] 46.72% | 705,780 | 6.0% |
[ 47.0% - 47.5% ] 47.30% | 832,835 | 7.2% |
[ 47.5% - 48.0% ] 47.83% | 276,281 | 6.5% |
[ 48.0% - 48.5% ] 48.14% | 168,574 | 6.2% |
[ 48.5% - 49.0% ] 48.74% | 799,666 | 9.8% |
[ 49.0% - 49.5% ] 49.28% | 847,079 | 6.7% |
[ 49.5% - 50.0% ] 49.69% | 163,925 | 5.4% |
[ 50.0% - 50.5% ] 50.28% | 640,490 | 4.4% |
[ 50.5% - 51.0% ] 50.78% | 713,265 | 7.5% |
[ 51.0% - 51.5% ] 51.18% | 322,007 | 4.8% |
[ 51.5% - 52.0% ] 51.67% | 305,734 | 4.6% |
[ 52.0% - 52.5% ] 52.33% | 193,026 | 11.0% |
[ 52.5% - 53.0% ] 52.76% | 236,458 | 2.7% |
[ 53.0% - 53.5% ] 53.23% | 136,143 | 9.5% |
[ 53.5% - 54.0% ] 53.81% | 463,502 | 8.6% |
[ 54.0% - 54.5% ] 54.17% | 370,622 | 5.4% |
[ 54.5% - 55.0% ] 54.78% | 593,729 | 2.8% |
[ 55.0% - 55.5% ] 55.18% | 457,004 | 6.0% |
[ 55.5% - 56.0% ] 55.61% | 146,820 | 3.2% |
[ 56.0% - 56.5% ] 56.17% | 91,391 | 10.9% |
[ 56.5% - 57.0% ] 56.71% | 75,557 | 9.9% |
[ 57.0% - 57.5% ] 57.13% | 110,508 | 3.4% |
[ 57.5% - 58.0% ] 57.84% | 597,162 | 3.1% |
[ 58.0% - 58.5% ] 58.34% | 98,125 | 2.0% |
[ 58.5% - 59.0% ] 58.80% | 221,458 | 4.3% |
[ 59.0% - 59.5% ] 59.19% | 86,760 | 0.71% |
[ 59.5% - 60.0% ] 59.93% | 14,371 | 0.13% |
[ 60.0% - 60.5% ] 60.30% | 153,212 | 1.8% |
[ 60.5% - 61.0% ] 60.53% | 35,967 | 1.9% |
[ 61.0% - 61.5% ] 61.13% | 58,079 | 2.9% |
[ 61.5% - 62.0% ] 61.88% | 128,561 | 6.3% |
[ 62.0% - 62.5% ] 62.28% | 93,984 | 1.9% |
[ 62.5% - 63.0% ] 62.58% | 26,268 | 3.4% |
[ 63.0% - 63.5% ] 63.43% | 24,597 | 9.3% |
[ 63.5% - 64.0% ] 63.91% | 115,520 | 8.4% |
[ 64.0% - 64.5% ] 64.33% | 109,357 | 3.7% |
[ 64.5% - 65.0% ] 64.88% | 105,802 | 6.9% |
[ 65.0% - 65.5% ] 65.07% | 48,096 | 2.2% |
[ 66.0% - 66.5% ] 66.17% | 152,851 | 3.2% |
[ 66.5% - 67.0% ] 66.91% | 109,332 | 4.9% |
[ 68.5% - 69.0% ] 68.68% | 119,624 | 3.2% |
[ 69.0% - 69.5% ] 69.26% | 90,791 | 4.8% |
[ 69.5% - 70.0% ] 69.58% | 766 | 1.4% |
[ 70.0% - 70.5% ] 70.39% | 115,169 | 2.4% |
[ 70.5% - 71.0% ] 70.81% | 129,053 | 2.8% |
[ 71.0% - 71.5% ] 71.37% | 45,620 | 3.4% |
[ 72.0% - 72.5% ] 72.50% | 160 | 19.1% |
[ 72.5% - 73.0% ] 72.85% | 57,066 | 2.4% |
[ 73.0% - 73.5% ] 73.31% | 29,830 | 8.5% |
[ 73.5% - 74.0% ] 73.75% | 19,399 | 5.2% |
[ 74.0% - 74.5% ] 74.15% | 257,738 | 5.5% |
[ 74.5% - 75.0% ] 74.68% | 46,798 | 3.8% |
[ 75.0% - 75.5% ] 75.10% | 71,088 | 6.5% |
[ 75.5% - 76.0% ] 75.74% | 1,018 | 2.5% |
[ 78.0% - 78.5% ] 78.37% | 42,081 | 5.3% |