Immigrants Self-Care Disability
COMPARE
Immigrants
Select to Compare
Self-Care Disability
Immigrants Self-Care Disability
2.5%
SELF-CARE DISABILITY
15.0/ 100
METRIC RATING
198th/ 347
METRIC RANK
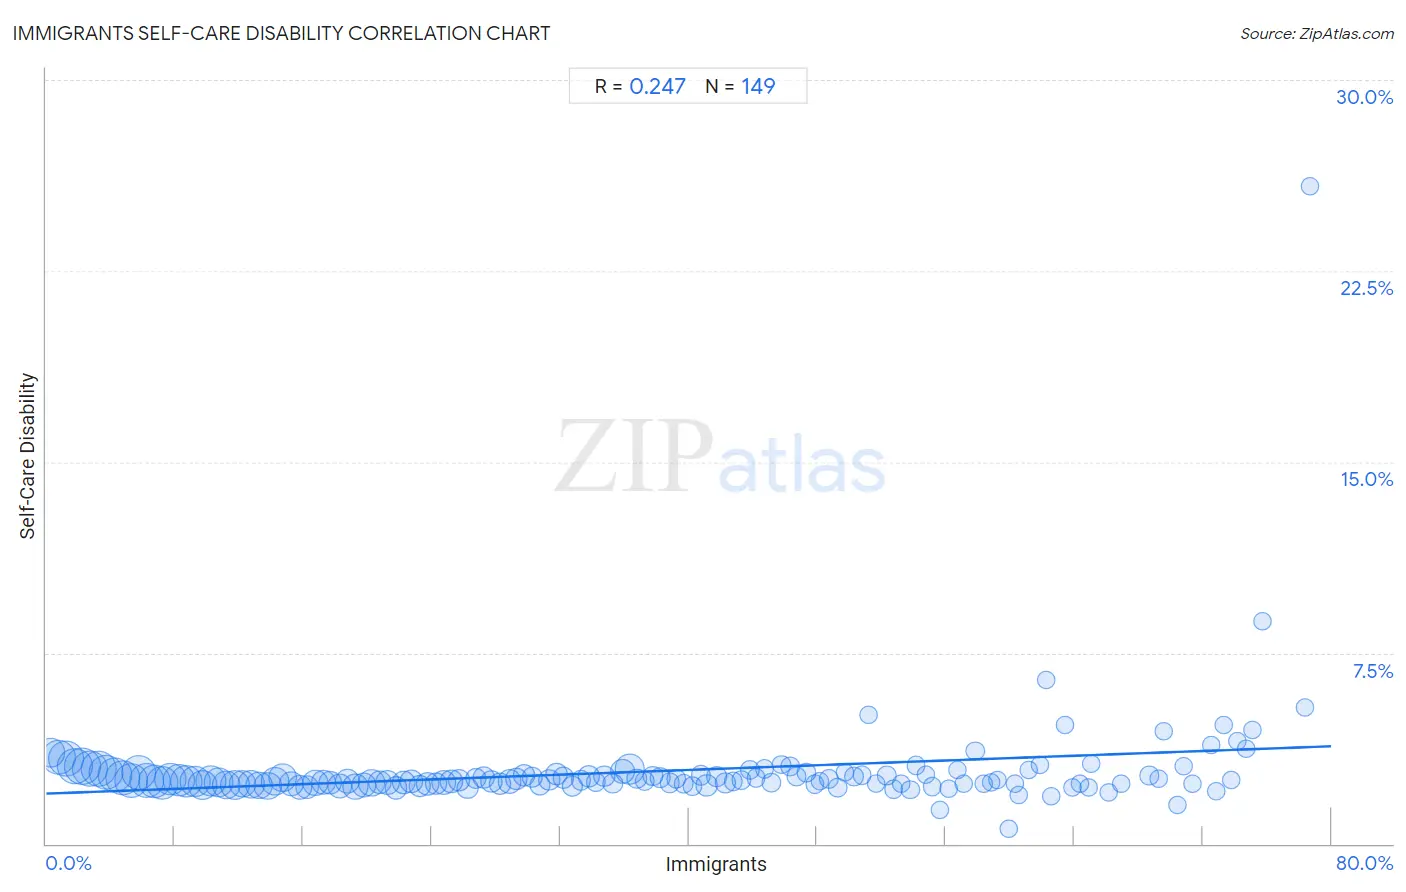
Immigrants Self-Care Disability Correlation Chart
The statistical analysis conducted on geographies consisting of 575,126,463 people shows a weak positive correlation between the proportion of Immigrants and percentage of population with self-care disability in the United States with a correlation coefficient (R) of 0.247 and weighted average of 2.5%. On average, for every 1% (one percent) increase in Immigrants within a typical geography, there is an increase of 0.023% in percentage of population with self-care disability.
It is essential to understand that the correlation between the percentage of Immigrants and percentage of population with self-care disability does not imply a direct cause-and-effect relationship. It remains uncertain whether the presence of Immigrants influences an upward or downward trend in the level of percentage of population with self-care disability within an area, or if Immigrants simply ended up residing in those areas with higher or lower levels of percentage of population with self-care disability due to other factors.
Demographics Similar to Immigrants by Self-Care Disability
In terms of self-care disability, the demographic groups most similar to Immigrants are Crow (2.5%, a difference of 0.020%), Immigrants from Ghana (2.5%, a difference of 0.020%), Korean (2.5%, a difference of 0.050%), Immigrants from Southern Europe (2.5%, a difference of 0.060%), and Immigrants from Western Africa (2.5%, a difference of 0.16%).
| Demographics | Rating | Rank | Self-Care Disability |
| Moroccans | 22.9 /100 | #191 | Fair 2.5% |
| Soviet Union | 22.2 /100 | #192 | Fair 2.5% |
| Ukrainians | 21.4 /100 | #193 | Fair 2.5% |
| Immigrants from Germany | 17.9 /100 | #194 | Poor 2.5% |
| Immigrants from Southern Europe | 15.6 /100 | #195 | Poor 2.5% |
| Koreans | 15.5 /100 | #196 | Poor 2.5% |
| Crow | 15.2 /100 | #197 | Poor 2.5% |
| Immigrants | 15.0 /100 | #198 | Poor 2.5% |
| Immigrants from Ghana | 14.7 /100 | #199 | Poor 2.5% |
| Immigrants from Western Africa | 13.3 /100 | #200 | Poor 2.5% |
| Immigrants from South Eastern Asia | 12.9 /100 | #201 | Poor 2.5% |
| Slovaks | 12.6 /100 | #202 | Poor 2.5% |
| Immigrants from Lebanon | 12.4 /100 | #203 | Poor 2.5% |
| Immigrants from Bahamas | 11.9 /100 | #204 | Poor 2.5% |
| Immigrants from Russia | 11.0 /100 | #205 | Poor 2.5% |
Immigrants Self-Care Disability Correlation Summary
| Measurement | Immigrants Data | Self-Care Disability Data |
| Minimum | 0.28% | 0.58% |
| Maximum | 78.7% | 25.8% |
| Range | 78.4% | 25.3% |
| Mean | 37.5% | 2.8% |
| Median | 37.3% | 2.5% |
| Interquartile 25% (IQ1) | 18.5% | 2.4% |
| Interquartile 75% (IQ3) | 55.9% | 2.7% |
| Interquartile Range (IQR) | 37.4% | 0.37% |
| Standard Deviation (Sample) | 22.0% | 2.1% |
| Standard Deviation (Population) | 22.0% | 2.1% |
Correlation Details
| Immigrants Percentile | Sample Size | Self-Care Disability |
[ 0.0% - 0.5% ] 0.28% | 9,717,136 | 3.6% |
[ 0.5% - 1.0% ] 0.76% | 14,811,305 | 3.4% |
[ 1.0% - 1.5% ] 1.25% | 15,801,786 | 3.3% |
[ 1.5% - 2.0% ] 1.75% | 15,642,081 | 3.1% |
[ 2.0% - 2.5% ] 2.24% | 16,617,753 | 3.0% |
[ 2.5% - 3.0% ] 2.74% | 15,689,474 | 2.9% |
[ 3.0% - 3.5% ] 3.24% | 15,635,816 | 3.0% |
[ 3.5% - 4.0% ] 3.75% | 14,787,527 | 2.8% |
[ 4.0% - 4.5% ] 4.25% | 14,590,535 | 2.7% |
[ 4.5% - 5.0% ] 4.75% | 13,856,491 | 2.6% |
[ 5.0% - 5.5% ] 5.26% | 13,421,892 | 2.5% |
[ 5.5% - 6.0% ] 5.75% | 14,414,470 | 2.8% |
[ 6.0% - 6.5% ] 6.24% | 13,619,160 | 2.5% |
[ 6.5% - 7.0% ] 6.75% | 13,056,081 | 2.5% |
[ 7.0% - 7.5% ] 7.24% | 12,589,185 | 2.4% |
[ 7.5% - 8.0% ] 7.74% | 11,563,423 | 2.5% |
[ 8.0% - 8.5% ] 8.23% | 11,926,278 | 2.5% |
[ 8.5% - 9.0% ] 8.74% | 12,074,063 | 2.5% |
[ 9.0% - 9.5% ] 9.25% | 10,761,507 | 2.4% |
[ 9.5% - 10.0% ] 9.76% | 9,876,246 | 2.3% |
[ 10.0% - 10.5% ] 10.26% | 11,671,389 | 2.5% |
[ 10.5% - 11.0% ] 10.74% | 10,214,738 | 2.4% |
[ 11.0% - 11.5% ] 11.24% | 8,886,313 | 2.3% |
[ 11.5% - 12.0% ] 11.76% | 9,950,703 | 2.3% |
[ 12.0% - 12.5% ] 12.22% | 7,640,352 | 2.4% |
[ 12.5% - 13.0% ] 12.75% | 7,903,174 | 2.3% |
[ 13.0% - 13.5% ] 13.25% | 7,123,009 | 2.3% |
[ 13.5% - 14.0% ] 13.80% | 8,293,213 | 2.3% |
[ 14.0% - 14.5% ] 14.24% | 8,786,900 | 2.5% |
[ 14.5% - 15.0% ] 14.73% | 8,580,043 | 2.6% |
[ 15.0% - 15.5% ] 15.23% | 5,422,816 | 2.4% |
[ 15.5% - 16.0% ] 15.77% | 5,906,826 | 2.2% |
[ 16.0% - 16.5% ] 16.23% | 5,011,196 | 2.2% |
[ 16.5% - 17.0% ] 16.74% | 6,082,538 | 2.4% |
[ 17.0% - 17.5% ] 17.25% | 5,944,516 | 2.4% |
[ 17.5% - 18.0% ] 17.70% | 4,129,066 | 2.4% |
[ 18.0% - 18.5% ] 18.25% | 5,989,321 | 2.3% |
[ 18.5% - 19.0% ] 18.78% | 5,655,895 | 2.5% |
[ 19.0% - 19.5% ] 19.26% | 5,932,557 | 2.2% |
[ 19.5% - 20.0% ] 19.74% | 5,469,376 | 2.3% |
[ 20.0% - 20.5% ] 20.27% | 7,101,317 | 2.4% |
[ 20.5% - 21.0% ] 20.77% | 4,819,098 | 2.4% |
[ 21.0% - 21.5% ] 21.23% | 5,544,933 | 2.4% |
[ 21.5% - 22.0% ] 21.77% | 3,707,344 | 2.2% |
[ 22.0% - 22.5% ] 22.23% | 4,414,046 | 2.4% |
[ 22.5% - 23.0% ] 22.73% | 4,298,503 | 2.4% |
[ 23.0% - 23.5% ] 23.24% | 3,754,146 | 2.3% |
[ 23.5% - 24.0% ] 23.76% | 4,197,559 | 2.4% |
[ 24.0% - 24.5% ] 24.28% | 3,594,545 | 2.4% |
[ 24.5% - 25.0% ] 24.75% | 5,518,422 | 2.4% |
[ 25.0% - 25.5% ] 25.25% | 4,173,160 | 2.4% |
[ 25.5% - 26.0% ] 25.69% | 2,913,603 | 2.5% |
[ 26.0% - 26.5% ] 26.24% | 3,195,957 | 2.2% |
[ 26.5% - 27.0% ] 26.76% | 2,751,860 | 2.6% |
[ 27.0% - 27.5% ] 27.27% | 3,315,933 | 2.6% |
[ 27.5% - 28.0% ] 27.73% | 2,975,892 | 2.5% |
[ 28.0% - 28.5% ] 28.24% | 3,346,794 | 2.3% |
[ 28.5% - 29.0% ] 28.86% | 5,098,343 | 2.4% |
[ 29.0% - 29.5% ] 29.27% | 3,111,753 | 2.6% |
[ 29.5% - 30.0% ] 29.76% | 2,776,453 | 2.7% |
[ 30.0% - 30.5% ] 30.27% | 2,692,373 | 2.6% |
[ 30.5% - 31.0% ] 30.74% | 2,238,158 | 2.3% |
[ 31.0% - 31.5% ] 31.31% | 2,413,734 | 2.5% |
[ 31.5% - 32.0% ] 31.75% | 2,833,221 | 2.7% |
[ 32.0% - 32.5% ] 32.21% | 2,885,220 | 2.6% |
[ 32.5% - 33.0% ] 32.75% | 2,367,731 | 2.3% |
[ 33.0% - 33.5% ] 33.27% | 1,733,575 | 2.5% |
[ 33.5% - 34.0% ] 33.74% | 3,243,983 | 2.7% |
[ 34.0% - 34.5% ] 34.23% | 1,748,793 | 2.4% |
[ 34.5% - 35.0% ] 34.74% | 2,388,398 | 2.7% |
[ 35.0% - 35.5% ] 35.26% | 1,586,317 | 2.4% |
[ 35.5% - 36.0% ] 35.91% | 5,379,585 | 2.8% |
[ 36.0% - 36.5% ] 36.32% | 10,444,994 | 2.9% |
[ 36.5% - 37.0% ] 36.77% | 1,316,204 | 2.5% |
[ 37.0% - 37.5% ] 37.26% | 1,595,737 | 2.5% |
[ 37.5% - 38.0% ] 37.76% | 1,535,793 | 2.7% |
[ 38.0% - 38.5% ] 38.23% | 1,933,804 | 2.6% |
[ 38.5% - 39.0% ] 38.81% | 1,609,841 | 2.4% |
[ 39.0% - 39.5% ] 39.23% | 1,153,997 | 2.6% |
[ 39.5% - 40.0% ] 39.69% | 1,201,389 | 2.4% |
[ 40.0% - 40.5% ] 40.25% | 1,247,112 | 2.2% |
[ 40.5% - 41.0% ] 40.76% | 1,733,444 | 2.7% |
[ 41.0% - 41.5% ] 41.11% | 2,636,336 | 2.3% |
[ 41.5% - 42.0% ] 41.73% | 1,523,600 | 2.6% |
[ 42.0% - 42.5% ] 42.28% | 1,498,140 | 2.4% |
[ 42.5% - 43.0% ] 42.78% | 815,790 | 2.4% |
[ 43.0% - 43.5% ] 43.26% | 888,429 | 2.5% |
[ 43.5% - 44.0% ] 43.79% | 1,286,121 | 2.9% |
[ 44.0% - 44.5% ] 44.20% | 369,140 | 2.6% |
[ 44.5% - 45.0% ] 44.72% | 858,196 | 2.9% |
[ 45.0% - 45.5% ] 45.14% | 871,621 | 2.4% |
[ 45.5% - 46.0% ] 45.75% | 704,973 | 3.1% |
[ 46.0% - 46.5% ] 46.30% | 774,831 | 3.0% |
[ 46.5% - 47.0% ] 46.72% | 694,636 | 2.6% |
[ 47.0% - 47.5% ] 47.30% | 841,252 | 2.8% |
[ 47.5% - 48.0% ] 47.83% | 277,496 | 2.3% |
[ 48.0% - 48.5% ] 48.14% | 168,854 | 2.5% |
[ 48.5% - 49.0% ] 48.74% | 842,067 | 2.5% |
[ 49.0% - 49.5% ] 49.28% | 846,575 | 2.2% |
[ 49.5% - 50.0% ] 49.69% | 165,722 | 2.8% |
[ 50.0% - 50.5% ] 50.28% | 640,490 | 2.6% |
[ 50.5% - 51.0% ] 50.79% | 730,167 | 2.7% |
[ 51.0% - 51.5% ] 51.18% | 319,766 | 5.1% |
[ 51.5% - 52.0% ] 51.67% | 305,734 | 2.3% |
[ 52.0% - 52.5% ] 52.32% | 204,872 | 2.7% |
[ 52.5% - 53.0% ] 52.76% | 236,458 | 2.1% |
[ 53.0% - 53.5% ] 53.23% | 130,421 | 2.4% |
[ 53.5% - 54.0% ] 53.81% | 463,452 | 2.1% |
[ 54.0% - 54.5% ] 54.17% | 370,692 | 3.1% |
[ 54.5% - 55.0% ] 54.78% | 593,586 | 2.7% |
[ 55.0% - 55.5% ] 55.18% | 482,691 | 2.2% |
[ 55.5% - 56.0% ] 55.61% | 148,289 | 1.3% |
[ 56.0% - 56.5% ] 56.17% | 89,843 | 2.2% |
[ 56.5% - 57.0% ] 56.72% | 75,873 | 2.9% |
[ 57.0% - 57.5% ] 57.13% | 110,508 | 2.3% |
[ 57.5% - 58.0% ] 57.84% | 596,139 | 3.6% |
[ 58.0% - 58.5% ] 58.34% | 97,943 | 2.4% |
[ 58.5% - 59.0% ] 58.80% | 221,458 | 2.4% |
[ 59.0% - 59.5% ] 59.19% | 86,903 | 2.5% |
[ 59.5% - 60.0% ] 59.92% | 15,664 | 0.58% |
[ 60.0% - 60.5% ] 60.30% | 154,064 | 2.4% |
[ 60.5% - 61.0% ] 60.53% | 36,392 | 1.9% |
[ 61.0% - 61.5% ] 61.13% | 58,079 | 2.9% |
[ 61.5% - 62.0% ] 61.88% | 128,746 | 3.1% |
[ 62.0% - 62.5% ] 62.28% | 93,794 | 6.5% |
[ 62.5% - 63.0% ] 62.58% | 26,090 | 1.9% |
[ 63.0% - 63.5% ] 63.42% | 24,955 | 4.7% |
[ 63.5% - 64.0% ] 63.91% | 117,426 | 2.2% |
[ 64.0% - 64.5% ] 64.33% | 109,357 | 2.4% |
[ 64.5% - 65.0% ] 64.88% | 104,741 | 2.2% |
[ 65.0% - 65.5% ] 65.08% | 51,333 | 3.1% |
[ 66.0% - 66.5% ] 66.17% | 152,851 | 2.0% |
[ 66.5% - 67.0% ] 66.91% | 109,332 | 2.3% |
[ 68.5% - 69.0% ] 68.68% | 119,624 | 2.7% |
[ 69.0% - 69.5% ] 69.26% | 90,791 | 2.5% |
[ 69.5% - 70.0% ] 69.58% | 766 | 4.4% |
[ 70.0% - 70.5% ] 70.39% | 115,169 | 1.5% |
[ 70.5% - 71.0% ] 70.79% | 138,035 | 3.1% |
[ 71.0% - 71.5% ] 71.37% | 45,620 | 2.4% |
[ 72.0% - 72.5% ] 72.50% | 160 | 3.9% |
[ 72.5% - 73.0% ] 72.85% | 57,066 | 2.0% |
[ 73.0% - 73.5% ] 73.31% | 29,830 | 4.7% |
[ 73.5% - 74.0% ] 73.75% | 19,399 | 2.5% |
[ 74.0% - 74.5% ] 74.15% | 257,738 | 4.0% |
[ 74.5% - 75.0% ] 74.68% | 46,798 | 3.7% |
[ 75.0% - 75.5% ] 75.10% | 71,088 | 4.5% |
[ 75.5% - 76.0% ] 75.74% | 1,018 | 8.7% |
[ 78.0% - 78.5% ] 78.37% | 42,081 | 5.4% |
[ 78.5% - 79.0% ] 78.65% | 178 | 25.8% |