Guatemalan Unemployment Among Women with Children Ages 6 to 17 years
COMPARE
Guatemalan
Select to Compare
Unemployment Among Women with Children Ages 6 to 17 years
Guatemalan Unemployment Among Women with Children Ages 6 to 17 years
9.3%
UNEMPLOYMENT | WOMEN W/ CHILDREN 6 TO 17
2.3/ 100
METRIC RATING
240th/ 347
METRIC RANK
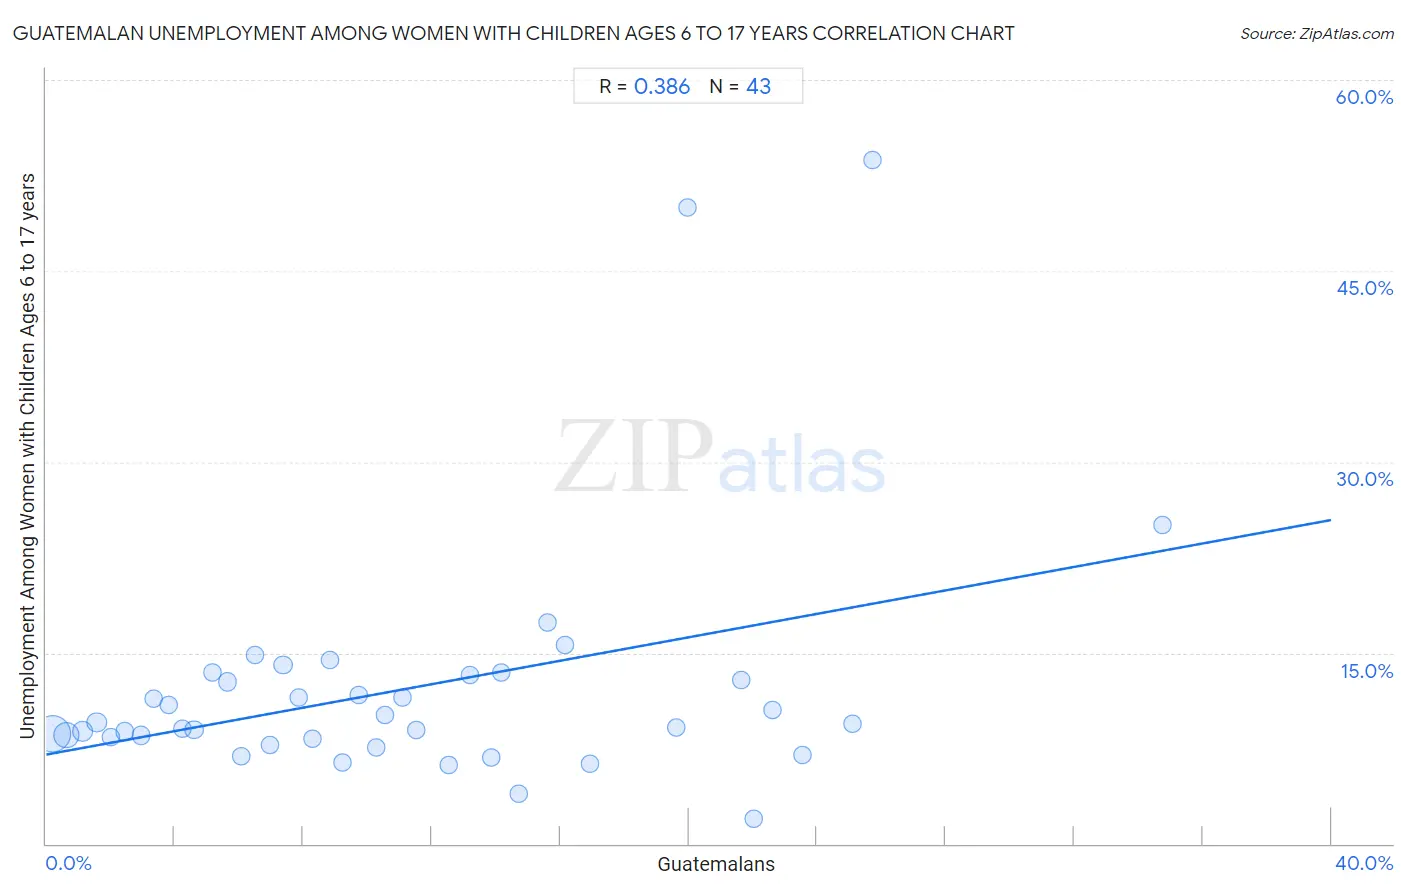
Guatemalan Unemployment Among Women with Children Ages 6 to 17 years Correlation Chart
The statistical analysis conducted on geographies consisting of 297,853,121 people shows a mild positive correlation between the proportion of Guatemalans and unemployment rate among women with children between the ages 6 and 17 in the United States with a correlation coefficient (R) of 0.386 and weighted average of 9.3%. On average, for every 1% (one percent) increase in Guatemalans within a typical geography, there is an increase of 0.46% in unemployment rate among women with children between the ages 6 and 17.
It is essential to understand that the correlation between the percentage of Guatemalans and unemployment rate among women with children between the ages 6 and 17 does not imply a direct cause-and-effect relationship. It remains uncertain whether the presence of Guatemalans influences an upward or downward trend in the level of unemployment rate among women with children between the ages 6 and 17 within an area, or if Guatemalans simply ended up residing in those areas with higher or lower levels of unemployment rate among women with children between the ages 6 and 17 due to other factors.
Demographics Similar to Guatemalans by Unemployment Among Women with Children Ages 6 to 17 years
In terms of unemployment among women with children ages 6 to 17 years, the demographic groups most similar to Guatemalans are Colombian (9.3%, a difference of 0.070%), Immigrants from Colombia (9.3%, a difference of 0.090%), Arab (9.3%, a difference of 0.14%), Immigrants from Saudi Arabia (9.3%, a difference of 0.14%), and Scottish (9.4%, a difference of 0.18%).
| Demographics | Rating | Rank | Unemployment Among Women with Children Ages 6 to 17 years |
| Immigrants from St. Vincent and the Grenadines | 3.3 /100 | #233 | Tragic 9.3% |
| Mexicans | 3.2 /100 | #234 | Tragic 9.3% |
| Uruguayans | 3.0 /100 | #235 | Tragic 9.3% |
| Hungarians | 3.0 /100 | #236 | Tragic 9.3% |
| Immigrants from Belize | 2.8 /100 | #237 | Tragic 9.3% |
| Arabs | 2.7 /100 | #238 | Tragic 9.3% |
| Immigrants from Saudi Arabia | 2.7 /100 | #239 | Tragic 9.3% |
| Guatemalans | 2.3 /100 | #240 | Tragic 9.3% |
| Colombians | 2.2 /100 | #241 | Tragic 9.3% |
| Immigrants from Colombia | 2.1 /100 | #242 | Tragic 9.3% |
| Scottish | 2.0 /100 | #243 | Tragic 9.4% |
| English | 1.9 /100 | #244 | Tragic 9.4% |
| Immigrants from Cameroon | 1.8 /100 | #245 | Tragic 9.4% |
| Immigrants from Africa | 1.6 /100 | #246 | Tragic 9.4% |
| Poles | 1.5 /100 | #247 | Tragic 9.4% |
Guatemalan Unemployment Among Women with Children Ages 6 to 17 years Correlation Summary
| Measurement | Guatemalan Data | Unemployment Among Women with Children Ages 6 to 17 years Data |
| Minimum | 0.18% | 2.0% |
| Maximum | 34.7% | 53.7% |
| Range | 34.6% | 51.7% |
| Mean | 11.3% | 12.2% |
| Median | 9.7% | 9.4% |
| Interquartile 25% (IQ1) | 4.6% | 8.2% |
| Interquartile 75% (IQ3) | 16.1% | 13.3% |
| Interquartile Range (IQR) | 11.5% | 5.1% |
| Standard Deviation (Sample) | 8.1% | 9.7% |
| Standard Deviation (Population) | 8.0% | 9.6% |
Correlation Details
| Guatemalan Percentile | Sample Size | Unemployment Among Women with Children Ages 6 to 17 years |
[ 0.0% - 0.5% ] 0.18% | 168,746,701 | 8.7% |
[ 0.5% - 1.0% ] 0.63% | 65,336,973 | 8.5% |
[ 1.0% - 1.5% ] 1.12% | 20,739,292 | 8.8% |
[ 1.5% - 2.0% ] 1.57% | 13,328,981 | 9.6% |
[ 2.0% - 2.5% ] 2.01% | 7,080,590 | 8.4% |
[ 2.0% - 2.5% ] 2.45% | 4,418,483 | 8.8% |
[ 2.5% - 3.0% ] 2.95% | 3,588,831 | 8.5% |
[ 3.0% - 3.5% ] 3.34% | 1,564,506 | 11.4% |
[ 3.5% - 4.0% ] 3.82% | 1,339,700 | 10.9% |
[ 4.0% - 4.5% ] 4.25% | 1,277,988 | 9.0% |
[ 4.5% - 5.0% ] 4.60% | 4,526,667 | 9.0% |
[ 5.0% - 5.5% ] 5.17% | 785,896 | 13.5% |
[ 5.5% - 6.0% ] 5.66% | 391,947 | 12.7% |
[ 6.0% - 6.5% ] 6.08% | 337,675 | 6.9% |
[ 6.0% - 6.5% ] 6.50% | 323,072 | 14.8% |
[ 6.5% - 7.0% ] 6.95% | 277,625 | 7.8% |
[ 7.0% - 7.5% ] 7.37% | 573,963 | 14.0% |
[ 7.5% - 8.0% ] 7.85% | 349,185 | 11.5% |
[ 8.0% - 8.5% ] 8.29% | 411,620 | 8.2% |
[ 8.5% - 9.0% ] 8.83% | 269,958 | 14.5% |
[ 9.0% - 9.5% ] 9.21% | 258,012 | 6.4% |
[ 9.5% - 10.0% ] 9.71% | 260,457 | 11.6% |
[ 10.0% - 10.5% ] 10.25% | 293,574 | 7.6% |
[ 10.5% - 11.0% ] 10.53% | 192,614 | 10.2% |
[ 11.0% - 11.5% ] 11.08% | 285,830 | 11.5% |
[ 11.5% - 12.0% ] 11.51% | 131,033 | 9.0% |
[ 12.5% - 13.0% ] 12.54% | 99,064 | 6.2% |
[ 13.0% - 13.5% ] 13.19% | 90,079 | 13.3% |
[ 13.5% - 14.0% ] 13.87% | 96,405 | 6.8% |
[ 14.0% - 14.5% ] 14.15% | 18,690 | 13.4% |
[ 14.5% - 15.0% ] 14.69% | 28,754 | 3.9% |
[ 15.5% - 16.0% ] 15.59% | 70,347 | 17.4% |
[ 16.0% - 16.5% ] 16.15% | 70,382 | 15.6% |
[ 16.5% - 17.0% ] 16.91% | 1,798 | 6.3% |
[ 19.5% - 20.0% ] 19.62% | 86,906 | 9.1% |
[ 19.5% - 20.0% ] 19.95% | 862 | 50.0% |
[ 21.5% - 22.0% ] 21.64% | 36,578 | 12.9% |
[ 22.0% - 22.5% ] 22.04% | 19,513 | 2.0% |
[ 22.5% - 23.0% ] 22.60% | 36,405 | 10.5% |
[ 23.5% - 24.0% ] 23.56% | 50,387 | 7.0% |
[ 25.0% - 25.5% ] 25.09% | 47,142 | 9.4% |
[ 25.5% - 26.0% ] 25.70% | 1,389 | 53.7% |
[ 34.5% - 35.0% ] 34.75% | 7,247 | 25.0% |