Guatemalan College, 1 year or more
COMPARE
Guatemalan
Select to Compare
College, 1 year or more
Guatemalan College, 1 year or more
51.2%
COLLEGE, 1 YEAR OR MORE
0.0/ 100
METRIC RATING
315th/ 347
METRIC RANK
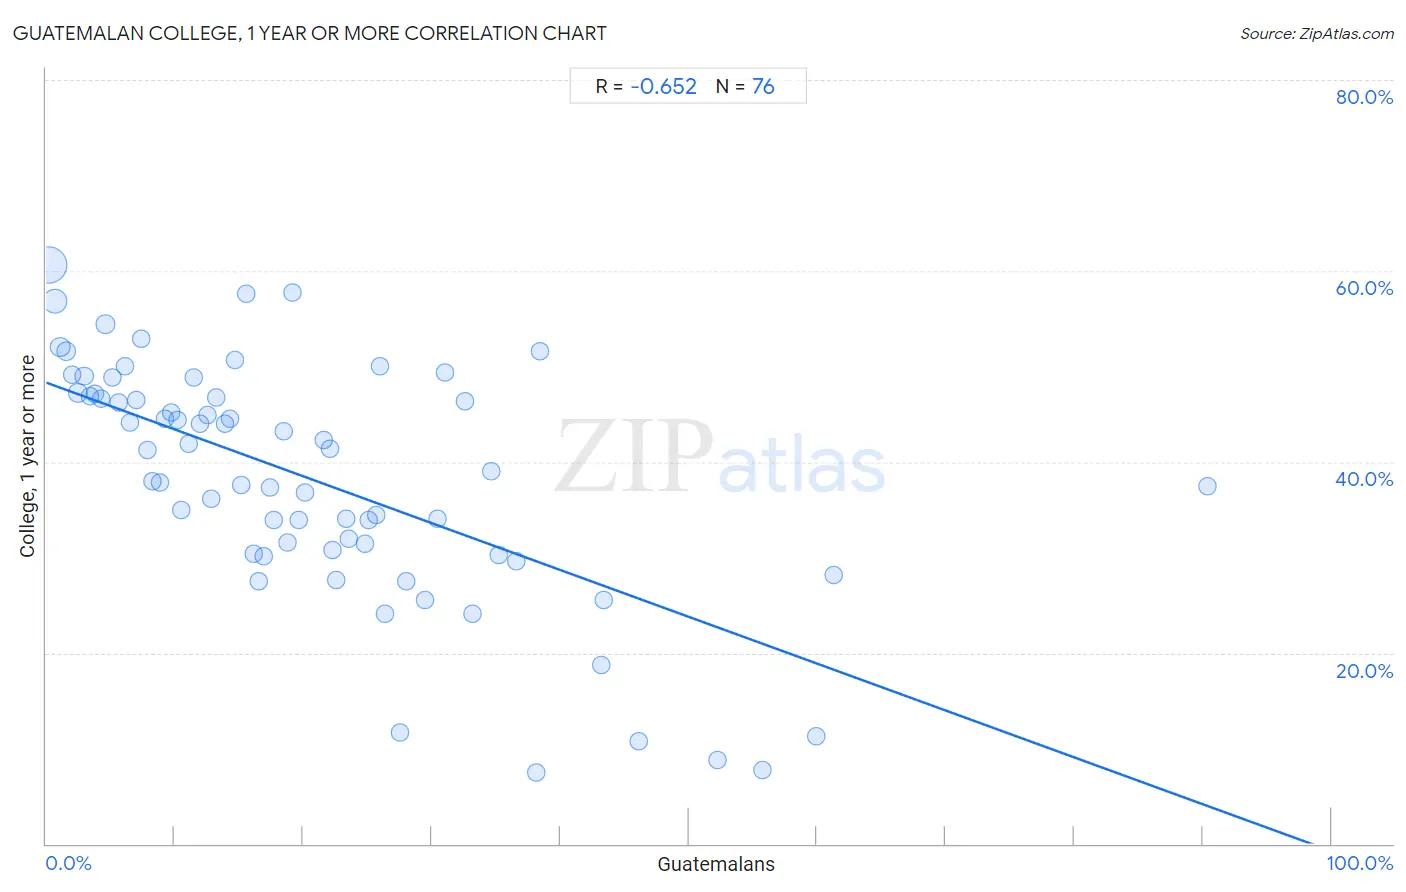
Guatemalan College, 1 year or more Correlation Chart
The statistical analysis conducted on geographies consisting of 409,563,742 people shows a significant negative correlation between the proportion of Guatemalans and percentage of population with at least college, 1 year or more education in the United States with a correlation coefficient (R) of -0.652 and weighted average of 51.2%. On average, for every 1% (one percent) increase in Guatemalans within a typical geography, there is a decrease of 0.49% in percentage of population with at least college, 1 year or more education.
It is essential to understand that the correlation between the percentage of Guatemalans and percentage of population with at least college, 1 year or more education does not imply a direct cause-and-effect relationship. It remains uncertain whether the presence of Guatemalans influences an upward or downward trend in the level of percentage of population with at least college, 1 year or more education within an area, or if Guatemalans simply ended up residing in those areas with higher or lower levels of percentage of population with at least college, 1 year or more education due to other factors.
Demographics Similar to Guatemalans by College, 1 year or more
In terms of college, 1 year or more, the demographic groups most similar to Guatemalans are Cajun (51.2%, a difference of 0.070%), Hispanic or Latino (51.1%, a difference of 0.16%), Fijian (51.3%, a difference of 0.23%), Immigrants from Honduras (51.0%, a difference of 0.29%), and Immigrants from El Salvador (51.0%, a difference of 0.38%).
| Demographics | Rating | Rank | College, 1 year or more |
| Salvadorans | 0.0 /100 | #308 | Tragic 51.8% |
| Apache | 0.0 /100 | #309 | Tragic 51.8% |
| Hondurans | 0.0 /100 | #310 | Tragic 51.6% |
| Immigrants from Haiti | 0.0 /100 | #311 | Tragic 51.5% |
| Pueblo | 0.0 /100 | #312 | Tragic 51.5% |
| Immigrants from Caribbean | 0.0 /100 | #313 | Tragic 51.4% |
| Fijians | 0.0 /100 | #314 | Tragic 51.3% |
| Guatemalans | 0.0 /100 | #315 | Tragic 51.2% |
| Cajuns | 0.0 /100 | #316 | Tragic 51.2% |
| Hispanics or Latinos | 0.0 /100 | #317 | Tragic 51.1% |
| Immigrants from Honduras | 0.0 /100 | #318 | Tragic 51.0% |
| Immigrants from El Salvador | 0.0 /100 | #319 | Tragic 51.0% |
| Kiowa | 0.0 /100 | #320 | Tragic 51.0% |
| Hopi | 0.0 /100 | #321 | Tragic 50.9% |
| Navajo | 0.0 /100 | #322 | Tragic 50.8% |
Guatemalan College, 1 year or more Correlation Summary
| Measurement | Guatemalan Data | College, 1 year or more Data |
| Minimum | 0.18% | 7.4% |
| Maximum | 90.3% | 60.6% |
| Range | 90.1% | 53.2% |
| Mean | 20.6% | 38.2% |
| Median | 17.2% | 40.1% |
| Interquartile 25% (IQ1) | 8.6% | 30.6% |
| Interquartile 75% (IQ3) | 27.7% | 47.0% |
| Interquartile Range (IQR) | 19.2% | 16.5% |
| Standard Deviation (Sample) | 16.6% | 12.5% |
| Standard Deviation (Population) | 16.5% | 12.4% |
Correlation Details
| Guatemalan Percentile | Sample Size | College, 1 year or more |
[ 0.0% - 0.5% ] 0.18% | 243,688,544 | 60.6% |
[ 0.5% - 1.0% ] 0.63% | 82,615,998 | 56.9% |
[ 1.0% - 1.5% ] 1.12% | 27,875,819 | 52.0% |
[ 1.5% - 2.0% ] 1.57% | 17,267,579 | 51.5% |
[ 2.0% - 2.5% ] 2.01% | 9,201,440 | 49.1% |
[ 2.0% - 2.5% ] 2.46% | 5,854,999 | 47.2% |
[ 2.5% - 3.0% ] 2.95% | 4,658,177 | 49.0% |
[ 3.0% - 3.5% ] 3.36% | 2,159,047 | 46.9% |
[ 3.5% - 4.0% ] 3.81% | 1,762,425 | 47.2% |
[ 4.0% - 4.5% ] 4.26% | 1,701,034 | 46.6% |
[ 4.5% - 5.0% ] 4.61% | 4,930,404 | 54.4% |
[ 5.0% - 5.5% ] 5.17% | 1,069,648 | 48.8% |
[ 5.5% - 6.0% ] 5.67% | 605,535 | 46.2% |
[ 6.0% - 6.5% ] 6.12% | 593,126 | 50.0% |
[ 6.5% - 7.0% ] 6.52% | 487,760 | 44.1% |
[ 6.5% - 7.0% ] 6.97% | 447,690 | 46.5% |
[ 7.0% - 7.5% ] 7.38% | 642,901 | 53.0% |
[ 7.5% - 8.0% ] 7.85% | 390,261 | 41.2% |
[ 8.0% - 8.5% ] 8.30% | 440,874 | 38.0% |
[ 8.5% - 9.0% ] 8.82% | 293,822 | 37.8% |
[ 9.0% - 9.5% ] 9.22% | 309,804 | 44.5% |
[ 9.5% - 10.0% ] 9.72% | 268,135 | 45.2% |
[ 10.0% - 10.5% ] 10.22% | 345,791 | 44.5% |
[ 10.5% - 11.0% ] 10.54% | 251,119 | 35.0% |
[ 11.0% - 11.5% ] 11.07% | 355,940 | 41.8% |
[ 11.5% - 12.0% ] 11.50% | 139,507 | 48.8% |
[ 11.5% - 12.0% ] 11.94% | 89,720 | 44.0% |
[ 12.5% - 13.0% ] 12.51% | 126,968 | 45.0% |
[ 12.5% - 13.0% ] 12.83% | 24,506 | 36.2% |
[ 13.0% - 13.5% ] 13.23% | 136,897 | 46.7% |
[ 13.5% - 14.0% ] 13.87% | 102,117 | 44.0% |
[ 14.0% - 14.5% ] 14.27% | 46,773 | 44.5% |
[ 14.5% - 15.0% ] 14.69% | 31,874 | 50.7% |
[ 15.0% - 15.5% ] 15.17% | 5,670 | 37.6% |
[ 15.5% - 16.0% ] 15.56% | 81,504 | 57.5% |
[ 16.0% - 16.5% ] 16.13% | 79,754 | 30.3% |
[ 16.5% - 17.0% ] 16.59% | 39,022 | 27.5% |
[ 16.5% - 17.0% ] 16.94% | 13,633 | 30.1% |
[ 17.0% - 17.5% ] 17.38% | 3,555 | 37.4% |
[ 17.5% - 18.0% ] 17.66% | 11,000 | 33.9% |
[ 18.5% - 19.0% ] 18.51% | 1,275 | 43.2% |
[ 18.5% - 19.0% ] 18.73% | 7,495 | 31.6% |
[ 19.0% - 19.5% ] 19.19% | 12,915 | 57.8% |
[ 19.5% - 20.0% ] 19.62% | 102,397 | 33.9% |
[ 20.0% - 20.5% ] 20.13% | 5,043 | 36.7% |
[ 21.5% - 22.0% ] 21.63% | 39,358 | 42.3% |
[ 22.0% - 22.5% ] 22.04% | 20,072 | 41.3% |
[ 22.0% - 22.5% ] 22.25% | 6,624 | 30.8% |
[ 22.5% - 23.0% ] 22.60% | 36,405 | 27.7% |
[ 23.0% - 23.5% ] 23.33% | 553 | 34.0% |
[ 23.5% - 24.0% ] 23.56% | 50,387 | 31.9% |
[ 24.5% - 25.0% ] 24.76% | 7,932 | 31.5% |
[ 25.0% - 25.5% ] 25.11% | 57,033 | 33.9% |
[ 25.5% - 26.0% ] 25.67% | 1,796 | 34.5% |
[ 26.0% - 26.5% ] 26.00% | 50 | 50.0% |
[ 26.0% - 26.5% ] 26.37% | 5,547 | 24.1% |
[ 27.0% - 27.5% ] 27.49% | 211 | 11.7% |
[ 27.5% - 28.0% ] 27.98% | 2,205 | 27.5% |
[ 29.0% - 29.5% ] 29.43% | 10,418 | 25.5% |
[ 30.0% - 30.5% ] 30.49% | 879 | 34.0% |
[ 31.0% - 31.5% ] 31.07% | 634 | 49.3% |
[ 32.5% - 33.0% ] 32.60% | 2,506 | 46.4% |
[ 33.0% - 33.5% ] 33.22% | 5,759 | 24.1% |
[ 34.5% - 35.0% ] 34.63% | 10,371 | 39.0% |
[ 35.0% - 35.5% ] 35.17% | 981 | 30.2% |
[ 36.5% - 37.0% ] 36.61% | 631 | 29.6% |
[ 38.0% - 38.5% ] 38.10% | 42 | 7.4% |
[ 38.0% - 38.5% ] 38.46% | 182 | 51.6% |
[ 43.0% - 43.5% ] 43.14% | 21,778 | 18.7% |
[ 43.0% - 43.5% ] 43.43% | 175 | 25.6% |
[ 46.0% - 46.5% ] 46.15% | 182 | 10.7% |
[ 52.0% - 52.5% ] 52.21% | 113 | 8.8% |
[ 55.5% - 56.0% ] 55.70% | 149 | 7.7% |
[ 59.5% - 60.0% ] 59.89% | 1,112 | 11.3% |
[ 61.0% - 61.5% ] 61.24% | 129 | 28.2% |
[ 90.0% - 90.5% ] 90.32% | 31 | 37.5% |