Guatemalan 3 or more Vehicles in Household
COMPARE
Guatemalan
Select to Compare
3 or more Vehicles in Household
Guatemalan 3 or more Vehicles in Household
20.1%
3+ VEHICLES AVAILABLE
82.6/ 100
METRIC RATING
148th/ 347
METRIC RANK
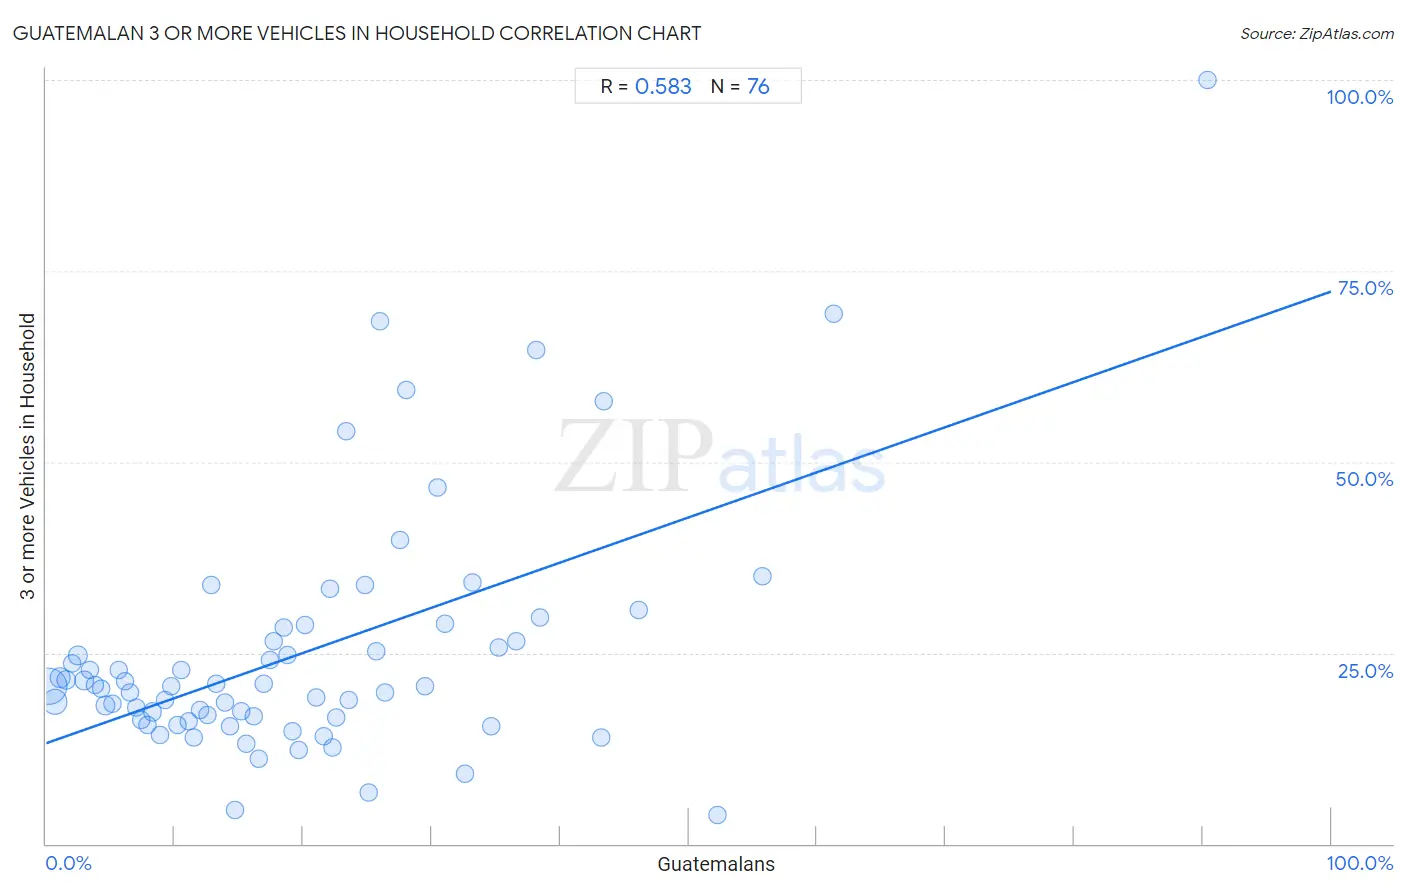
Guatemalan 3 or more Vehicles in Household Correlation Chart
The statistical analysis conducted on geographies consisting of 409,244,641 people shows a substantial positive correlation between the proportion of Guatemalans and percentage of households with 3 or more vehicles available in the United States with a correlation coefficient (R) of 0.583 and weighted average of 20.1%. On average, for every 1% (one percent) increase in Guatemalans within a typical geography, there is an increase of 0.59% in percentage of households with 3 or more vehicles available.
It is essential to understand that the correlation between the percentage of Guatemalans and percentage of households with 3 or more vehicles available does not imply a direct cause-and-effect relationship. It remains uncertain whether the presence of Guatemalans influences an upward or downward trend in the level of percentage of households with 3 or more vehicles available within an area, or if Guatemalans simply ended up residing in those areas with higher or lower levels of percentage of households with 3 or more vehicles available due to other factors.
Demographics Similar to Guatemalans by 3 or more Vehicles in Household
In terms of 3 or more vehicles in household, the demographic groups most similar to Guatemalans are Slovak (20.1%, a difference of 0.060%), Australian (20.1%, a difference of 0.14%), Palestinian (20.1%, a difference of 0.18%), Iranian (20.1%, a difference of 0.19%), and Immigrants from Iran (20.0%, a difference of 0.20%).
| Demographics | Rating | Rank | 3 or more Vehicles in Household |
| Ottawa | 84.9 /100 | #141 | Excellent 20.1% |
| Jordanians | 84.4 /100 | #142 | Excellent 20.1% |
| Lithuanians | 84.4 /100 | #143 | Excellent 20.1% |
| Iranians | 84.0 /100 | #144 | Excellent 20.1% |
| Palestinians | 83.9 /100 | #145 | Excellent 20.1% |
| Australians | 83.6 /100 | #146 | Excellent 20.1% |
| Slovaks | 83.0 /100 | #147 | Excellent 20.1% |
| Guatemalans | 82.6 /100 | #148 | Excellent 20.1% |
| Immigrants from Iran | 80.9 /100 | #149 | Excellent 20.0% |
| Immigrants | 80.8 /100 | #150 | Excellent 20.0% |
| Taiwanese | 80.6 /100 | #151 | Excellent 20.0% |
| Lebanese | 79.8 /100 | #152 | Good 20.0% |
| Yuman | 75.6 /100 | #153 | Good 19.9% |
| Immigrants from Jordan | 75.0 /100 | #154 | Good 19.9% |
| Tlingit-Haida | 73.4 /100 | #155 | Good 19.9% |
Guatemalan 3 or more Vehicles in Household Correlation Summary
| Measurement | Guatemalan Data | 3 or more Vehicles in Household Data |
| Minimum | 0.18% | 3.8% |
| Maximum | 90.3% | 100.0% |
| Range | 90.1% | 96.2% |
| Mean | 20.1% | 25.1% |
| Median | 17.2% | 20.6% |
| Interquartile 25% (IQ1) | 8.6% | 16.3% |
| Interquartile 75% (IQ3) | 26.9% | 27.4% |
| Interquartile Range (IQR) | 18.4% | 11.1% |
| Standard Deviation (Sample) | 15.9% | 16.1% |
| Standard Deviation (Population) | 15.8% | 16.0% |
Correlation Details
| Guatemalan Percentile | Sample Size | 3 or more Vehicles in Household |
[ 0.0% - 0.5% ] 0.18% | 243,487,140 | 20.6% |
[ 0.5% - 1.0% ] 0.63% | 82,530,593 | 18.6% |
[ 1.0% - 1.5% ] 1.12% | 27,862,824 | 21.8% |
[ 1.5% - 2.0% ] 1.57% | 17,260,976 | 21.5% |
[ 2.0% - 2.5% ] 2.01% | 9,197,337 | 23.6% |
[ 2.0% - 2.5% ] 2.46% | 5,851,590 | 24.6% |
[ 2.5% - 3.0% ] 2.95% | 4,656,994 | 21.4% |
[ 3.0% - 3.5% ] 3.36% | 2,158,803 | 22.8% |
[ 3.5% - 4.0% ] 3.81% | 1,762,425 | 20.7% |
[ 4.0% - 4.5% ] 4.26% | 1,701,034 | 20.3% |
[ 4.5% - 5.0% ] 4.61% | 4,930,404 | 18.1% |
[ 5.0% - 5.5% ] 5.17% | 1,068,926 | 18.3% |
[ 5.5% - 6.0% ] 5.67% | 605,535 | 22.7% |
[ 6.0% - 6.5% ] 6.12% | 593,126 | 21.3% |
[ 6.5% - 7.0% ] 6.52% | 487,760 | 19.8% |
[ 6.5% - 7.0% ] 6.97% | 447,344 | 17.8% |
[ 7.0% - 7.5% ] 7.38% | 642,901 | 16.1% |
[ 7.5% - 8.0% ] 7.85% | 389,471 | 15.5% |
[ 8.0% - 8.5% ] 8.30% | 440,874 | 17.3% |
[ 8.5% - 9.0% ] 8.82% | 293,822 | 14.2% |
[ 9.0% - 9.5% ] 9.22% | 309,804 | 18.8% |
[ 9.5% - 10.0% ] 9.72% | 267,864 | 20.7% |
[ 10.0% - 10.5% ] 10.22% | 345,791 | 15.6% |
[ 10.5% - 11.0% ] 10.54% | 251,119 | 22.8% |
[ 11.0% - 11.5% ] 11.07% | 355,718 | 16.0% |
[ 11.5% - 12.0% ] 11.50% | 139,507 | 14.0% |
[ 11.5% - 12.0% ] 11.94% | 89,720 | 17.5% |
[ 12.5% - 13.0% ] 12.51% | 126,968 | 16.9% |
[ 12.5% - 13.0% ] 12.83% | 24,506 | 33.9% |
[ 13.0% - 13.5% ] 13.23% | 136,897 | 20.9% |
[ 13.5% - 14.0% ] 13.87% | 102,117 | 18.4% |
[ 14.0% - 14.5% ] 14.27% | 46,773 | 15.5% |
[ 14.5% - 15.0% ] 14.69% | 31,874 | 4.4% |
[ 15.0% - 15.5% ] 15.17% | 5,670 | 17.4% |
[ 15.5% - 16.0% ] 15.56% | 81,504 | 13.1% |
[ 16.0% - 16.5% ] 16.13% | 79,754 | 16.7% |
[ 16.5% - 17.0% ] 16.59% | 39,022 | 11.1% |
[ 16.5% - 17.0% ] 16.94% | 13,633 | 20.9% |
[ 17.0% - 17.5% ] 17.38% | 3,555 | 24.0% |
[ 17.5% - 18.0% ] 17.66% | 11,000 | 26.5% |
[ 18.5% - 19.0% ] 18.51% | 1,275 | 28.3% |
[ 18.5% - 19.0% ] 18.73% | 7,495 | 24.8% |
[ 19.0% - 19.5% ] 19.19% | 12,915 | 14.8% |
[ 19.5% - 20.0% ] 19.62% | 102,397 | 12.3% |
[ 20.0% - 20.5% ] 20.13% | 5,043 | 28.6% |
[ 20.5% - 21.0% ] 20.97% | 267 | 19.2% |
[ 21.5% - 22.0% ] 21.63% | 39,358 | 14.1% |
[ 22.0% - 22.5% ] 22.04% | 19,513 | 33.4% |
[ 22.0% - 22.5% ] 22.25% | 6,624 | 12.6% |
[ 22.5% - 23.0% ] 22.60% | 36,405 | 16.5% |
[ 23.0% - 23.5% ] 23.33% | 553 | 54.1% |
[ 23.5% - 24.0% ] 23.56% | 50,387 | 18.8% |
[ 24.5% - 25.0% ] 24.76% | 7,932 | 33.8% |
[ 25.0% - 25.5% ] 25.11% | 57,033 | 6.8% |
[ 25.5% - 26.0% ] 25.67% | 1,796 | 25.2% |
[ 26.0% - 26.5% ] 26.00% | 50 | 68.4% |
[ 26.0% - 26.5% ] 26.37% | 5,547 | 19.9% |
[ 27.0% - 27.5% ] 27.49% | 211 | 39.7% |
[ 27.5% - 28.0% ] 27.98% | 2,205 | 59.3% |
[ 29.0% - 29.5% ] 29.43% | 10,418 | 20.6% |
[ 30.0% - 30.5% ] 30.49% | 879 | 46.6% |
[ 31.0% - 31.5% ] 31.07% | 634 | 28.8% |
[ 32.5% - 33.0% ] 32.60% | 2,506 | 9.2% |
[ 33.0% - 33.5% ] 33.22% | 5,759 | 34.2% |
[ 34.5% - 35.0% ] 34.63% | 10,371 | 15.3% |
[ 35.0% - 35.5% ] 35.17% | 981 | 25.7% |
[ 36.5% - 37.0% ] 36.61% | 631 | 26.4% |
[ 38.0% - 38.5% ] 38.10% | 42 | 64.7% |
[ 38.0% - 38.5% ] 38.46% | 182 | 29.6% |
[ 43.0% - 43.5% ] 43.14% | 21,778 | 13.8% |
[ 43.0% - 43.5% ] 43.43% | 175 | 57.9% |
[ 46.0% - 46.5% ] 46.15% | 182 | 30.6% |
[ 52.0% - 52.5% ] 52.21% | 113 | 3.8% |
[ 55.5% - 56.0% ] 55.70% | 149 | 35.0% |
[ 61.0% - 61.5% ] 61.24% | 129 | 69.4% |
[ 90.0% - 90.5% ] 90.32% | 31 | 100.0% |