Guatemalan 4 or more Vehicles in Household
COMPARE
Guatemalan
Select to Compare
4 or more Vehicles in Household
Guatemalan 4 or more Vehicles in Household
7.0%
4+ VEHICLES AVAILABLE
98.1/ 100
METRIC RATING
106th/ 347
METRIC RANK
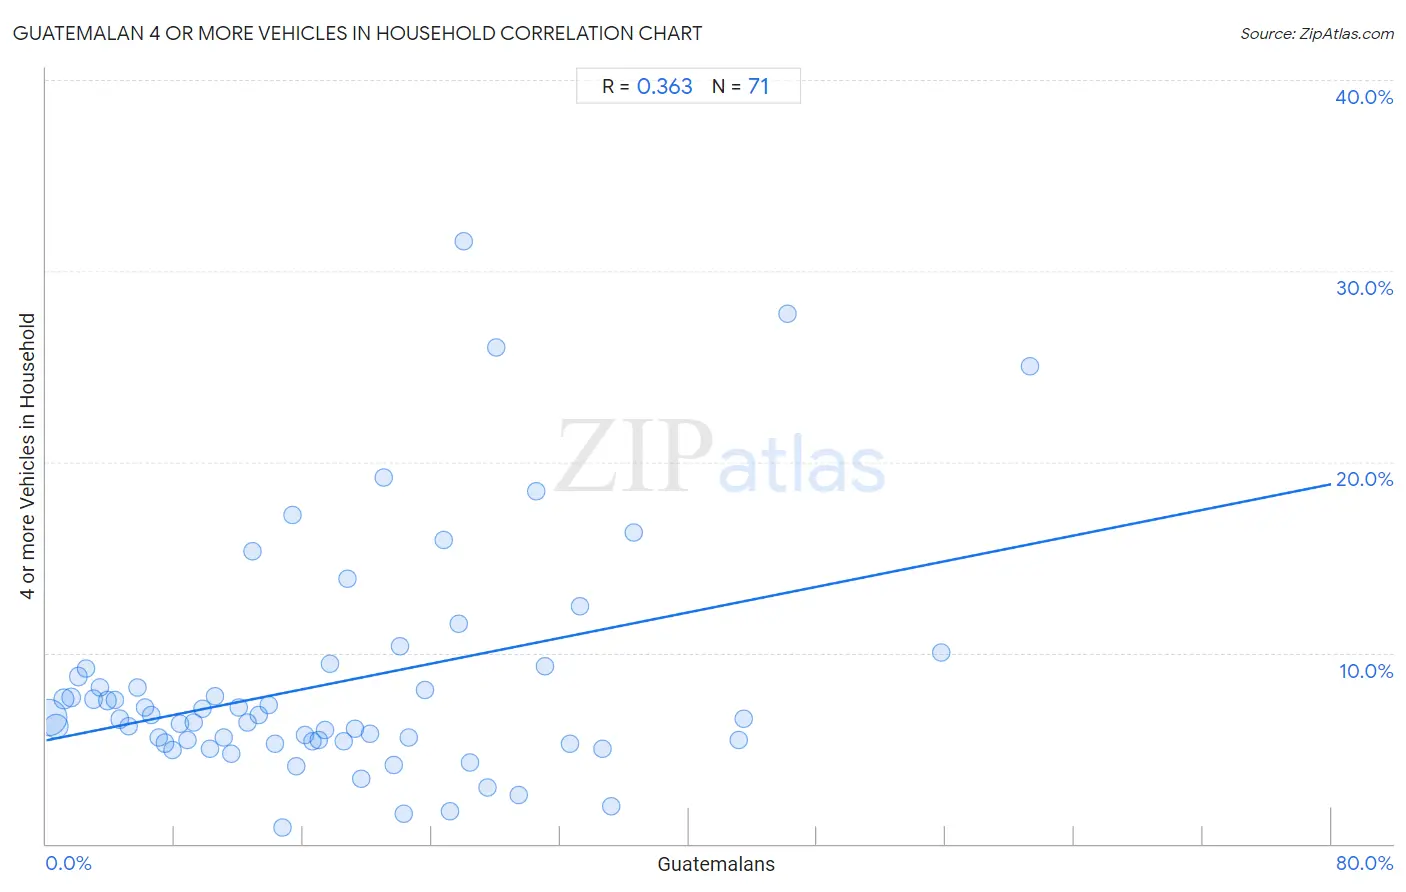
Guatemalan 4 or more Vehicles in Household Correlation Chart
The statistical analysis conducted on geographies consisting of 407,811,821 people shows a mild positive correlation between the proportion of Guatemalans and percentage of households with 4 or more vehicles available in the United States with a correlation coefficient (R) of 0.363 and weighted average of 7.0%. On average, for every 1% (one percent) increase in Guatemalans within a typical geography, there is an increase of 0.17% in percentage of households with 4 or more vehicles available.
It is essential to understand that the correlation between the percentage of Guatemalans and percentage of households with 4 or more vehicles available does not imply a direct cause-and-effect relationship. It remains uncertain whether the presence of Guatemalans influences an upward or downward trend in the level of percentage of households with 4 or more vehicles available within an area, or if Guatemalans simply ended up residing in those areas with higher or lower levels of percentage of households with 4 or more vehicles available due to other factors.
Demographics Similar to Guatemalans by 4 or more Vehicles in Household
In terms of 4 or more vehicles in household, the demographic groups most similar to Guatemalans are Nicaraguan (7.0%, a difference of 0.010%), German Russian (7.0%, a difference of 0.34%), Hmong (7.0%, a difference of 0.35%), French (6.9%, a difference of 0.35%), and Filipino (6.9%, a difference of 0.53%).
| Demographics | Rating | Rank | 4 or more Vehicles in Household |
| Seminole | 98.8 /100 | #99 | Exceptional 7.0% |
| Taiwanese | 98.7 /100 | #100 | Exceptional 7.0% |
| Pakistanis | 98.7 /100 | #101 | Exceptional 7.0% |
| Asians | 98.6 /100 | #102 | Exceptional 7.0% |
| Blackfeet | 98.6 /100 | #103 | Exceptional 7.0% |
| Hmong | 98.3 /100 | #104 | Exceptional 7.0% |
| German Russians | 98.3 /100 | #105 | Exceptional 7.0% |
| Guatemalans | 98.1 /100 | #106 | Exceptional 7.0% |
| Nicaraguans | 98.0 /100 | #107 | Exceptional 7.0% |
| French | 97.7 /100 | #108 | Exceptional 6.9% |
| Filipinos | 97.6 /100 | #109 | Exceptional 6.9% |
| Immigrants from Thailand | 97.0 /100 | #110 | Exceptional 6.9% |
| Aleuts | 97.0 /100 | #111 | Exceptional 6.9% |
| Hopi | 97.0 /100 | #112 | Exceptional 6.9% |
| Canadians | 96.4 /100 | #113 | Exceptional 6.9% |
Guatemalan 4 or more Vehicles in Household Correlation Summary
| Measurement | Guatemalan Data | 4 or more Vehicles in Household Data |
| Minimum | 0.18% | 0.82% |
| Maximum | 61.2% | 31.6% |
| Range | 61.1% | 30.8% |
| Mean | 18.1% | 8.5% |
| Median | 16.1% | 6.6% |
| Interquartile 25% (IQ1) | 7.9% | 5.4% |
| Interquartile 75% (IQ3) | 25.7% | 9.2% |
| Interquartile Range (IQR) | 17.8% | 3.8% |
| Standard Deviation (Sample) | 13.1% | 6.1% |
| Standard Deviation (Population) | 13.1% | 6.0% |
Correlation Details
| Guatemalan Percentile | Sample Size | 4 or more Vehicles in Household |
[ 0.0% - 0.5% ] 0.18% | 242,523,881 | 6.6% |
[ 0.5% - 1.0% ] 0.63% | 82,307,232 | 6.2% |
[ 1.0% - 1.5% ] 1.12% | 27,758,326 | 7.6% |
[ 1.5% - 2.0% ] 1.57% | 17,242,755 | 7.7% |
[ 2.0% - 2.5% ] 2.01% | 9,147,749 | 8.8% |
[ 2.0% - 2.5% ] 2.45% | 5,828,802 | 9.2% |
[ 2.5% - 3.0% ] 2.95% | 4,655,767 | 7.6% |
[ 3.0% - 3.5% ] 3.36% | 2,154,817 | 8.2% |
[ 3.5% - 4.0% ] 3.81% | 1,762,425 | 7.5% |
[ 4.0% - 4.5% ] 4.26% | 1,699,197 | 7.6% |
[ 4.5% - 5.0% ] 4.61% | 4,924,563 | 6.5% |
[ 5.0% - 5.5% ] 5.17% | 1,059,668 | 6.2% |
[ 5.5% - 6.0% ] 5.67% | 605,535 | 8.2% |
[ 6.0% - 6.5% ] 6.12% | 587,088 | 7.1% |
[ 6.5% - 7.0% ] 6.52% | 487,474 | 6.7% |
[ 6.5% - 7.0% ] 6.97% | 447,344 | 5.6% |
[ 7.0% - 7.5% ] 7.38% | 642,716 | 5.3% |
[ 7.5% - 8.0% ] 7.85% | 389,471 | 4.9% |
[ 8.0% - 8.5% ] 8.30% | 440,874 | 6.3% |
[ 8.5% - 9.0% ] 8.82% | 293,166 | 5.4% |
[ 9.0% - 9.5% ] 9.22% | 309,804 | 6.4% |
[ 9.5% - 10.0% ] 9.72% | 267,864 | 7.1% |
[ 10.0% - 10.5% ] 10.22% | 345,791 | 5.0% |
[ 10.5% - 11.0% ] 10.54% | 250,246 | 7.7% |
[ 11.0% - 11.5% ] 11.07% | 355,718 | 5.5% |
[ 11.5% - 12.0% ] 11.50% | 139,507 | 4.7% |
[ 11.5% - 12.0% ] 11.95% | 80,737 | 7.2% |
[ 12.5% - 13.0% ] 12.52% | 124,738 | 6.3% |
[ 12.5% - 13.0% ] 12.83% | 24,506 | 15.3% |
[ 13.0% - 13.5% ] 13.23% | 136,897 | 6.8% |
[ 13.5% - 14.0% ] 13.87% | 102,117 | 7.3% |
[ 14.0% - 14.5% ] 14.27% | 46,773 | 5.3% |
[ 14.5% - 15.0% ] 14.69% | 31,570 | 0.82% |
[ 15.0% - 15.5% ] 15.31% | 2,358 | 17.2% |
[ 15.5% - 16.0% ] 15.56% | 81,504 | 4.0% |
[ 16.0% - 16.5% ] 16.13% | 79,754 | 5.7% |
[ 16.5% - 17.0% ] 16.59% | 39,022 | 5.4% |
[ 16.5% - 17.0% ] 16.94% | 13,633 | 5.5% |
[ 17.0% - 17.5% ] 17.38% | 3,555 | 6.0% |
[ 17.5% - 18.0% ] 17.67% | 8,743 | 9.4% |
[ 18.5% - 19.0% ] 18.51% | 1,275 | 5.4% |
[ 18.5% - 19.0% ] 18.73% | 7,495 | 13.9% |
[ 19.0% - 19.5% ] 19.18% | 11,249 | 6.1% |
[ 19.5% - 20.0% ] 19.62% | 102,397 | 3.4% |
[ 20.0% - 20.5% ] 20.13% | 5,043 | 5.8% |
[ 20.5% - 21.0% ] 20.97% | 267 | 19.2% |
[ 21.5% - 22.0% ] 21.63% | 39,358 | 4.1% |
[ 22.0% - 22.5% ] 22.04% | 19,513 | 10.3% |
[ 22.0% - 22.5% ] 22.25% | 6,624 | 1.5% |
[ 22.5% - 23.0% ] 22.60% | 36,405 | 5.6% |
[ 23.5% - 24.0% ] 23.56% | 50,387 | 8.0% |
[ 24.5% - 25.0% ] 24.75% | 6,687 | 15.9% |
[ 25.0% - 25.5% ] 25.11% | 57,033 | 1.7% |
[ 25.5% - 26.0% ] 25.67% | 1,796 | 11.5% |
[ 26.0% - 26.5% ] 26.00% | 50 | 31.6% |
[ 26.0% - 26.5% ] 26.37% | 5,547 | 4.3% |
[ 27.0% - 27.5% ] 27.49% | 211 | 2.9% |
[ 27.5% - 28.0% ] 27.98% | 2,205 | 26.0% |
[ 29.0% - 29.5% ] 29.43% | 10,418 | 2.5% |
[ 30.0% - 30.5% ] 30.49% | 879 | 18.5% |
[ 31.0% - 31.5% ] 31.07% | 634 | 9.3% |
[ 32.5% - 33.0% ] 32.60% | 2,506 | 5.3% |
[ 33.0% - 33.5% ] 33.22% | 5,759 | 12.4% |
[ 34.5% - 35.0% ] 34.63% | 10,371 | 5.0% |
[ 35.0% - 35.5% ] 35.17% | 981 | 2.0% |
[ 36.5% - 37.0% ] 36.61% | 631 | 16.3% |
[ 43.0% - 43.5% ] 43.14% | 21,778 | 5.4% |
[ 43.0% - 43.5% ] 43.43% | 175 | 6.6% |
[ 46.0% - 46.5% ] 46.15% | 182 | 27.8% |
[ 55.5% - 56.0% ] 55.70% | 149 | 10.0% |
[ 61.0% - 61.5% ] 61.24% | 129 | 25.0% |