Guatemalan Married-couple Households
COMPARE
Guatemalan
Select to Compare
Married-couple Households
Guatemalan Married-couple Households
43.3%
MARRIED-COUPLE HOUSEHOLDS
0.1/ 100
METRIC RATING
271st/ 347
METRIC RANK
Guatemalan Married-couple Households Correlation Chart
The statistical analysis conducted on geographies consisting of 409,284,876 people shows a poor negative correlation between the proportion of Guatemalans and percentage of married-couple family households in the United States with a correlation coefficient (R) of -0.124 and weighted average of 43.3%. On average, for every 1% (one percent) increase in Guatemalans within a typical geography, there is a decrease of 0.081% in percentage of married-couple family households.
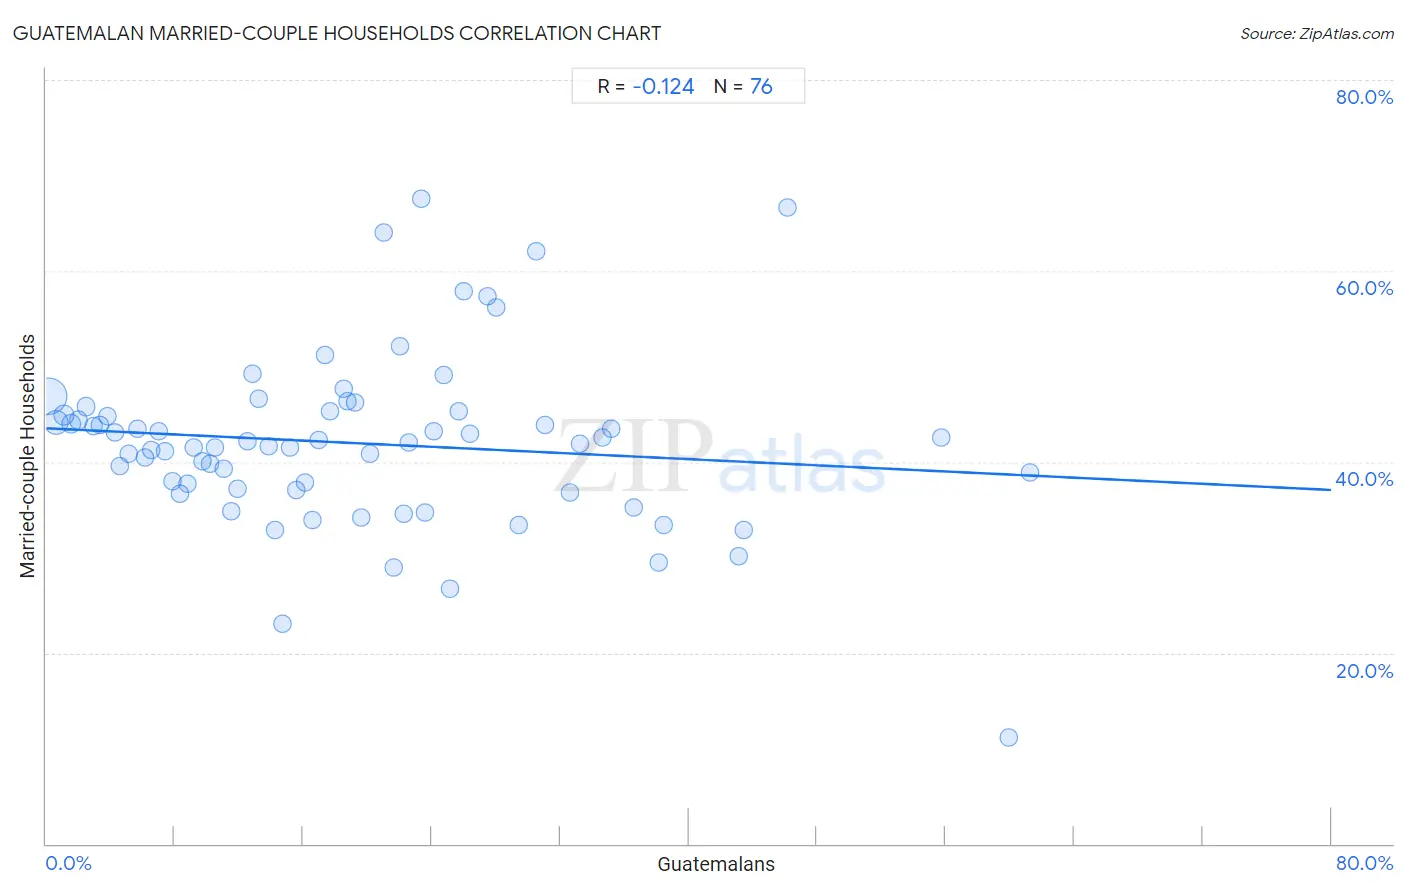
It is essential to understand that the correlation between the percentage of Guatemalans and percentage of married-couple family households does not imply a direct cause-and-effect relationship. It remains uncertain whether the presence of Guatemalans influences an upward or downward trend in the level of percentage of married-couple family households within an area, or if Guatemalans simply ended up residing in those areas with higher or lower levels of percentage of married-couple family households due to other factors.
Demographics Similar to Guatemalans by Married-couple Households
In terms of married-couple households, the demographic groups most similar to Guatemalans are Yuman (43.3%, a difference of 0.11%), Immigrants from Nigeria (43.2%, a difference of 0.11%), Immigrants from Sierra Leone (43.3%, a difference of 0.15%), Ethiopian (43.2%, a difference of 0.20%), and Nigerian (43.2%, a difference of 0.21%).
| Demographics | Rating | Rank | Married-couple Households |
| Bangladeshis | 0.1 /100 | #264 | Tragic 43.5% |
| Moroccans | 0.1 /100 | #265 | Tragic 43.5% |
| Ecuadorians | 0.1 /100 | #266 | Tragic 43.5% |
| Natives/Alaskans | 0.1 /100 | #267 | Tragic 43.5% |
| Immigrants from Burma/Myanmar | 0.1 /100 | #268 | Tragic 43.4% |
| Immigrants from Sierra Leone | 0.1 /100 | #269 | Tragic 43.3% |
| Yuman | 0.1 /100 | #270 | Tragic 43.3% |
| Guatemalans | 0.1 /100 | #271 | Tragic 43.3% |
| Immigrants from Nigeria | 0.1 /100 | #272 | Tragic 43.2% |
| Ethiopians | 0.1 /100 | #273 | Tragic 43.2% |
| Nigerians | 0.1 /100 | #274 | Tragic 43.2% |
| Immigrants from Bangladesh | 0.0 /100 | #275 | Tragic 43.1% |
| Immigrants from Ethiopia | 0.0 /100 | #276 | Tragic 43.1% |
| Immigrants from Eastern Africa | 0.0 /100 | #277 | Tragic 42.9% |
| Immigrants from Africa | 0.0 /100 | #278 | Tragic 42.9% |
Guatemalan Married-couple Households Correlation Summary
| Measurement | Guatemalan Data | Married-couple Households Data |
| Minimum | 0.18% | 11.2% |
| Maximum | 61.2% | 67.5% |
| Range | 61.1% | 56.3% |
| Mean | 19.3% | 42.0% |
| Median | 17.2% | 41.9% |
| Interquartile 25% (IQ1) | 8.6% | 37.1% |
| Interquartile 75% (IQ3) | 26.2% | 45.1% |
| Interquartile Range (IQR) | 17.6% | 8.0% |
| Standard Deviation (Sample) | 14.0% | 9.1% |
| Standard Deviation (Population) | 13.9% | 9.0% |
Correlation Details
| Guatemalan Percentile | Sample Size | Married-couple Households |
[ 0.0% - 0.5% ] 0.18% | 243,517,761 | 46.9% |
[ 0.5% - 1.0% ] 0.63% | 82,537,399 | 44.1% |
[ 1.0% - 1.5% ] 1.12% | 27,863,573 | 44.9% |
[ 1.5% - 2.0% ] 1.57% | 17,260,976 | 44.0% |
[ 2.0% - 2.5% ] 2.01% | 9,197,337 | 44.3% |
[ 2.0% - 2.5% ] 2.46% | 5,851,590 | 45.8% |
[ 2.5% - 3.0% ] 2.95% | 4,657,098 | 43.8% |
[ 3.0% - 3.5% ] 3.36% | 2,158,803 | 43.9% |
[ 3.5% - 4.0% ] 3.81% | 1,762,425 | 44.8% |
[ 4.0% - 4.5% ] 4.26% | 1,700,811 | 43.1% |
[ 4.5% - 5.0% ] 4.61% | 4,930,404 | 39.6% |
[ 5.0% - 5.5% ] 5.17% | 1,068,926 | 40.8% |
[ 5.5% - 6.0% ] 5.67% | 605,535 | 43.4% |
[ 6.0% - 6.5% ] 6.12% | 593,126 | 40.5% |
[ 6.5% - 7.0% ] 6.52% | 487,760 | 41.2% |
[ 6.5% - 7.0% ] 6.97% | 447,690 | 43.3% |
[ 7.0% - 7.5% ] 7.38% | 642,901 | 41.1% |
[ 7.5% - 8.0% ] 7.85% | 389,471 | 38.0% |
[ 8.0% - 8.5% ] 8.30% | 440,874 | 36.7% |
[ 8.5% - 9.0% ] 8.82% | 293,822 | 37.7% |
[ 9.0% - 9.5% ] 9.22% | 309,804 | 41.5% |
[ 9.5% - 10.0% ] 9.72% | 267,864 | 40.0% |
[ 10.0% - 10.5% ] 10.22% | 345,791 | 39.8% |
[ 10.5% - 11.0% ] 10.54% | 251,119 | 41.5% |
[ 11.0% - 11.5% ] 11.07% | 355,940 | 39.3% |
[ 11.5% - 12.0% ] 11.50% | 139,507 | 34.9% |
[ 11.5% - 12.0% ] 11.94% | 89,720 | 37.2% |
[ 12.5% - 13.0% ] 12.51% | 126,968 | 42.2% |
[ 12.5% - 13.0% ] 12.83% | 24,506 | 49.2% |
[ 13.0% - 13.5% ] 13.23% | 136,897 | 46.6% |
[ 13.5% - 14.0% ] 13.87% | 102,117 | 41.6% |
[ 14.0% - 14.5% ] 14.27% | 46,773 | 32.9% |
[ 14.5% - 15.0% ] 14.69% | 31,874 | 23.1% |
[ 15.0% - 15.5% ] 15.17% | 5,670 | 41.5% |
[ 15.5% - 16.0% ] 15.56% | 81,504 | 37.0% |
[ 16.0% - 16.5% ] 16.13% | 79,754 | 37.9% |
[ 16.5% - 17.0% ] 16.59% | 39,022 | 33.9% |
[ 16.5% - 17.0% ] 16.94% | 13,633 | 42.4% |
[ 17.0% - 17.5% ] 17.38% | 3,555 | 51.3% |
[ 17.5% - 18.0% ] 17.66% | 11,000 | 45.2% |
[ 18.5% - 19.0% ] 18.51% | 1,275 | 47.7% |
[ 18.5% - 19.0% ] 18.73% | 7,495 | 46.4% |
[ 19.0% - 19.5% ] 19.19% | 12,915 | 46.2% |
[ 19.5% - 20.0% ] 19.62% | 102,397 | 34.1% |
[ 20.0% - 20.5% ] 20.13% | 5,043 | 40.9% |
[ 20.5% - 21.0% ] 20.97% | 267 | 64.0% |
[ 21.5% - 22.0% ] 21.63% | 39,358 | 29.0% |
[ 22.0% - 22.5% ] 22.04% | 20,072 | 52.1% |
[ 22.0% - 22.5% ] 22.25% | 6,624 | 34.6% |
[ 22.5% - 23.0% ] 22.60% | 36,405 | 42.0% |
[ 23.0% - 23.5% ] 23.33% | 553 | 67.5% |
[ 23.5% - 24.0% ] 23.56% | 50,387 | 34.6% |
[ 24.0% - 24.5% ] 24.10% | 83 | 43.2% |
[ 24.5% - 25.0% ] 24.76% | 7,932 | 49.1% |
[ 25.0% - 25.5% ] 25.11% | 57,033 | 26.6% |
[ 25.5% - 26.0% ] 25.67% | 1,796 | 45.3% |
[ 26.0% - 26.5% ] 26.00% | 50 | 57.9% |
[ 26.0% - 26.5% ] 26.37% | 5,547 | 42.9% |
[ 27.0% - 27.5% ] 27.49% | 211 | 57.4% |
[ 27.5% - 28.0% ] 27.98% | 2,205 | 56.2% |
[ 29.0% - 29.5% ] 29.43% | 10,418 | 33.4% |
[ 30.0% - 30.5% ] 30.49% | 879 | 62.1% |
[ 31.0% - 31.5% ] 31.07% | 634 | 43.9% |
[ 32.5% - 33.0% ] 32.60% | 2,506 | 36.8% |
[ 33.0% - 33.5% ] 33.22% | 5,759 | 41.9% |
[ 34.5% - 35.0% ] 34.63% | 10,371 | 42.5% |
[ 35.0% - 35.5% ] 35.17% | 981 | 43.4% |
[ 36.5% - 37.0% ] 36.61% | 631 | 35.3% |
[ 38.0% - 38.5% ] 38.10% | 42 | 29.4% |
[ 38.0% - 38.5% ] 38.46% | 182 | 33.3% |
[ 43.0% - 43.5% ] 43.14% | 21,778 | 30.1% |
[ 43.0% - 43.5% ] 43.43% | 175 | 32.9% |
[ 46.0% - 46.5% ] 46.15% | 182 | 66.7% |
[ 55.5% - 56.0% ] 55.70% | 149 | 42.5% |
[ 59.5% - 60.0% ] 59.89% | 1,112 | 11.2% |
[ 61.0% - 61.5% ] 61.24% | 129 | 38.9% |