Guatemalan Self-Care Disability
COMPARE
Guatemalan
Select to Compare
Self-Care Disability
Guatemalan Self-Care Disability
2.6%
SELF-CARE DISABILITY
2.7/ 100
METRIC RATING
228th/ 347
METRIC RANK
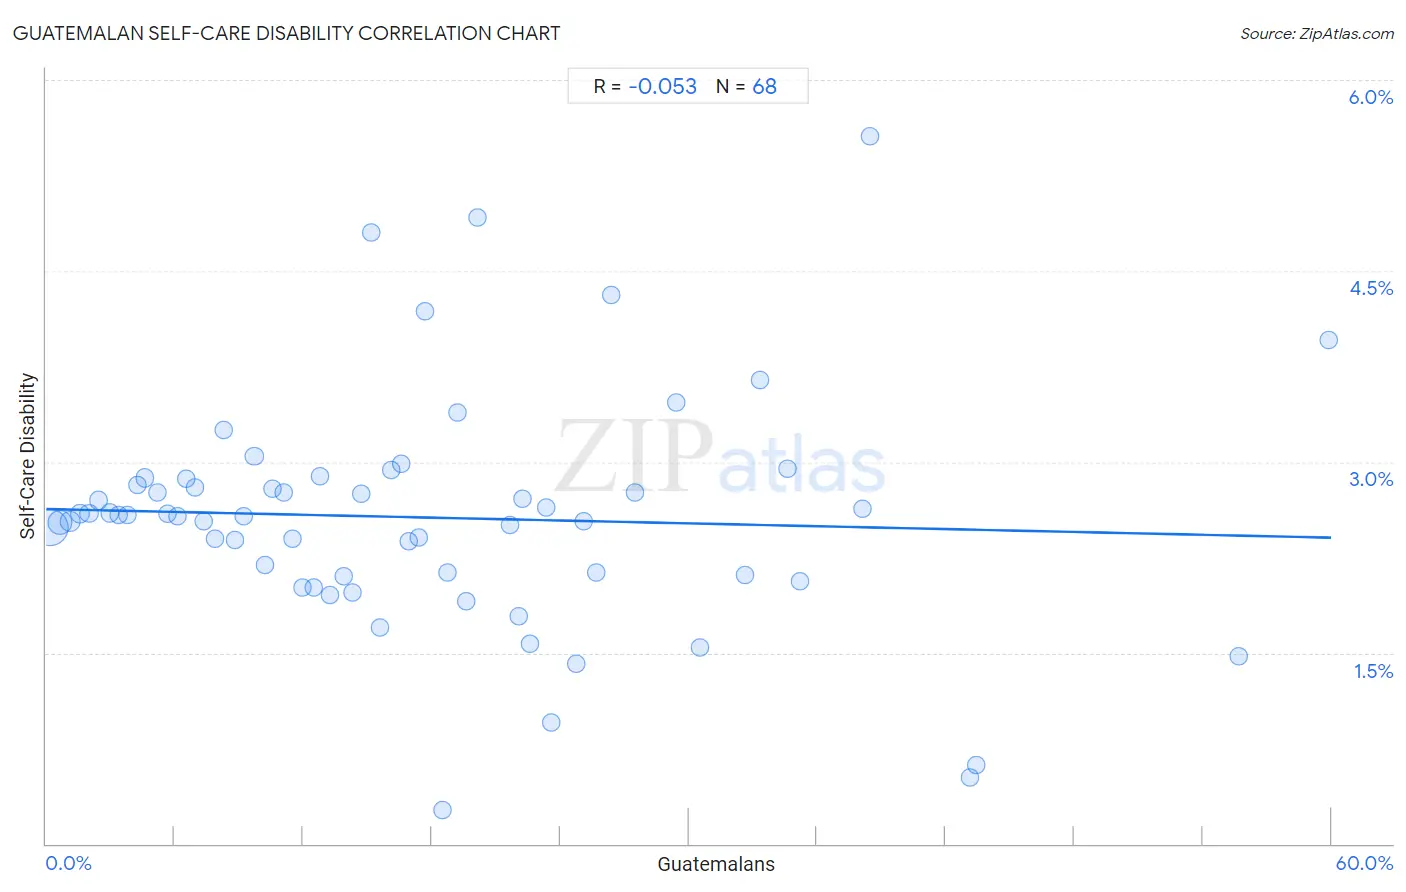
Guatemalan Self-Care Disability Correlation Chart
The statistical analysis conducted on geographies consisting of 408,997,178 people shows a slight negative correlation between the proportion of Guatemalans and percentage of population with self-care disability in the United States with a correlation coefficient (R) of -0.053 and weighted average of 2.6%. On average, for every 1% (one percent) increase in Guatemalans within a typical geography, there is a decrease of 0.0037% in percentage of population with self-care disability.
It is essential to understand that the correlation between the percentage of Guatemalans and percentage of population with self-care disability does not imply a direct cause-and-effect relationship. It remains uncertain whether the presence of Guatemalans influences an upward or downward trend in the level of percentage of population with self-care disability within an area, or if Guatemalans simply ended up residing in those areas with higher or lower levels of percentage of population with self-care disability due to other factors.
Demographics Similar to Guatemalans by Self-Care Disability
In terms of self-care disability, the demographic groups most similar to Guatemalans are Immigrants from Philippines (2.6%, a difference of 0.010%), Guamanian/Chamorro (2.6%, a difference of 0.070%), Immigrants from Ecuador (2.6%, a difference of 0.080%), Chinese (2.6%, a difference of 0.090%), and Iraqi (2.6%, a difference of 0.19%).
| Demographics | Rating | Rank | Self-Care Disability |
| Hondurans | 3.8 /100 | #221 | Tragic 2.6% |
| Spaniards | 3.8 /100 | #222 | Tragic 2.6% |
| French Canadians | 3.8 /100 | #223 | Tragic 2.6% |
| Osage | 3.6 /100 | #224 | Tragic 2.6% |
| Iraqis | 3.2 /100 | #225 | Tragic 2.6% |
| Chinese | 2.9 /100 | #226 | Tragic 2.6% |
| Immigrants from Philippines | 2.7 /100 | #227 | Tragic 2.6% |
| Guatemalans | 2.7 /100 | #228 | Tragic 2.6% |
| Guamanians/Chamorros | 2.5 /100 | #229 | Tragic 2.6% |
| Immigrants from Ecuador | 2.5 /100 | #230 | Tragic 2.6% |
| Immigrants from Guatemala | 2.2 /100 | #231 | Tragic 2.6% |
| Albanians | 2.2 /100 | #232 | Tragic 2.6% |
| Liberians | 2.1 /100 | #233 | Tragic 2.6% |
| Vietnamese | 2.1 /100 | #234 | Tragic 2.6% |
| Bahamians | 2.0 /100 | #235 | Tragic 2.6% |
Guatemalan Self-Care Disability Correlation Summary
| Measurement | Guatemalan Data | Self-Care Disability Data |
| Minimum | 0.18% | 0.26% |
| Maximum | 59.9% | 5.6% |
| Range | 59.7% | 5.3% |
| Mean | 17.6% | 2.6% |
| Median | 15.4% | 2.6% |
| Interquartile 25% (IQ1) | 7.6% | 2.1% |
| Interquartile 75% (IQ3) | 24.2% | 2.8% |
| Interquartile Range (IQR) | 16.5% | 0.73% |
| Standard Deviation (Sample) | 13.0% | 0.92% |
| Standard Deviation (Population) | 12.9% | 0.91% |
Correlation Details
| Guatemalan Percentile | Sample Size | Self-Care Disability |
[ 0.0% - 0.5% ] 0.18% | 243,406,779 | 2.5% |
[ 0.5% - 1.0% ] 0.63% | 82,492,393 | 2.5% |
[ 1.0% - 1.5% ] 1.12% | 27,826,627 | 2.5% |
[ 1.5% - 2.0% ] 1.57% | 17,248,910 | 2.6% |
[ 2.0% - 2.5% ] 2.01% | 9,194,212 | 2.6% |
[ 2.0% - 2.5% ] 2.46% | 5,841,322 | 2.7% |
[ 2.5% - 3.0% ] 2.95% | 4,644,279 | 2.6% |
[ 3.0% - 3.5% ] 3.36% | 2,158,081 | 2.6% |
[ 3.5% - 4.0% ] 3.81% | 1,759,917 | 2.6% |
[ 4.0% - 4.5% ] 4.25% | 1,687,980 | 2.8% |
[ 4.5% - 5.0% ] 4.61% | 4,926,760 | 2.9% |
[ 5.0% - 5.5% ] 5.17% | 1,065,261 | 2.8% |
[ 5.5% - 6.0% ] 5.67% | 601,523 | 2.6% |
[ 6.0% - 6.5% ] 6.12% | 590,182 | 2.6% |
[ 6.5% - 7.0% ] 6.52% | 485,934 | 2.9% |
[ 6.5% - 7.0% ] 6.97% | 443,566 | 2.8% |
[ 7.0% - 7.5% ] 7.38% | 642,183 | 2.5% |
[ 7.5% - 8.0% ] 7.85% | 388,995 | 2.4% |
[ 8.0% - 8.5% ] 8.30% | 440,874 | 3.3% |
[ 8.5% - 9.0% ] 8.82% | 293,822 | 2.4% |
[ 9.0% - 9.5% ] 9.22% | 308,618 | 2.6% |
[ 9.5% - 10.0% ] 9.72% | 266,812 | 3.0% |
[ 10.0% - 10.5% ] 10.22% | 344,701 | 2.2% |
[ 10.5% - 11.0% ] 10.54% | 250,246 | 2.8% |
[ 11.0% - 11.5% ] 11.07% | 355,415 | 2.8% |
[ 11.5% - 12.0% ] 11.50% | 138,288 | 2.4% |
[ 11.5% - 12.0% ] 11.94% | 89,720 | 2.0% |
[ 12.5% - 13.0% ] 12.51% | 126,968 | 2.0% |
[ 12.5% - 13.0% ] 12.81% | 22,839 | 2.9% |
[ 13.0% - 13.5% ] 13.23% | 135,197 | 1.9% |
[ 13.5% - 14.0% ] 13.87% | 102,117 | 2.1% |
[ 14.0% - 14.5% ] 14.27% | 46,669 | 2.0% |
[ 14.5% - 15.0% ] 14.69% | 31,570 | 2.7% |
[ 15.0% - 15.5% ] 15.17% | 5,670 | 4.8% |
[ 15.5% - 16.0% ] 15.56% | 81,504 | 1.7% |
[ 16.0% - 16.5% ] 16.13% | 79,754 | 2.9% |
[ 16.5% - 17.0% ] 16.59% | 39,022 | 3.0% |
[ 16.5% - 17.0% ] 16.94% | 13,633 | 2.4% |
[ 17.0% - 17.5% ] 17.38% | 3,555 | 2.4% |
[ 17.5% - 18.0% ] 17.66% | 11,000 | 4.2% |
[ 18.5% - 19.0% ] 18.51% | 1,275 | 0.26% |
[ 18.5% - 19.0% ] 18.73% | 7,495 | 2.1% |
[ 19.0% - 19.5% ] 19.19% | 12,295 | 3.4% |
[ 19.5% - 20.0% ] 19.62% | 102,397 | 1.9% |
[ 20.0% - 20.5% ] 20.11% | 3,347 | 4.9% |
[ 21.5% - 22.0% ] 21.63% | 39,358 | 2.5% |
[ 22.0% - 22.5% ] 22.04% | 19,513 | 1.8% |
[ 22.0% - 22.5% ] 22.25% | 6,624 | 2.7% |
[ 22.5% - 23.0% ] 22.60% | 36,405 | 1.6% |
[ 23.0% - 23.5% ] 23.33% | 553 | 2.6% |
[ 23.5% - 24.0% ] 23.56% | 50,387 | 0.95% |
[ 24.5% - 25.0% ] 24.76% | 7,932 | 1.4% |
[ 25.0% - 25.5% ] 25.11% | 57,033 | 2.5% |
[ 25.5% - 26.0% ] 25.67% | 1,796 | 2.1% |
[ 26.0% - 26.5% ] 26.37% | 5,547 | 4.3% |
[ 27.0% - 27.5% ] 27.49% | 211 | 2.8% |
[ 29.0% - 29.5% ] 29.43% | 10,418 | 3.5% |
[ 30.5% - 31.0% ] 30.55% | 635 | 1.5% |
[ 32.5% - 33.0% ] 32.60% | 2,506 | 2.1% |
[ 33.0% - 33.5% ] 33.32% | 3,763 | 3.6% |
[ 34.5% - 35.0% ] 34.63% | 10,371 | 2.9% |
[ 35.0% - 35.5% ] 35.17% | 981 | 2.1% |
[ 38.0% - 38.5% ] 38.10% | 42 | 2.6% |
[ 38.0% - 38.5% ] 38.46% | 182 | 5.6% |
[ 43.0% - 43.5% ] 43.14% | 21,778 | 0.52% |
[ 43.0% - 43.5% ] 43.43% | 175 | 0.62% |
[ 55.5% - 56.0% ] 55.70% | 149 | 1.5% |
[ 59.5% - 60.0% ] 59.89% | 1,112 | 4.0% |