Ethiopian College, 1 year or more
COMPARE
Ethiopian
Select to Compare
College, 1 year or more
Ethiopian College, 1 year or more
62.9%
COLLEGE, 1 YEAR OR MORE
98.8/ 100
METRIC RATING
77th/ 347
METRIC RANK
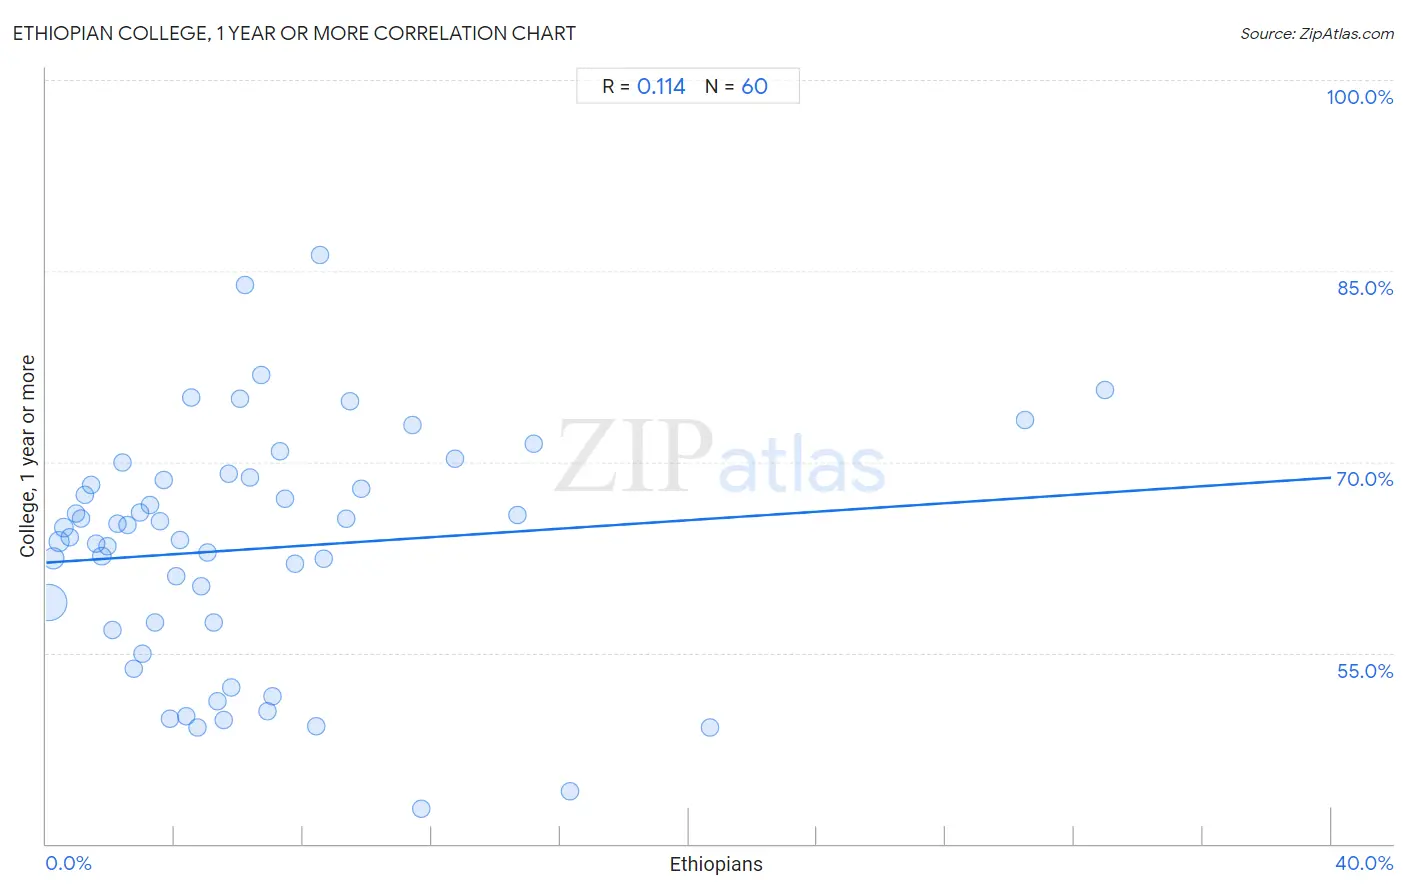
Ethiopian College, 1 year or more Correlation Chart
The statistical analysis conducted on geographies consisting of 223,259,495 people shows a poor positive correlation between the proportion of Ethiopians and percentage of population with at least college, 1 year or more education in the United States with a correlation coefficient (R) of 0.114 and weighted average of 62.9%. On average, for every 1% (one percent) increase in Ethiopians within a typical geography, there is an increase of 0.17% in percentage of population with at least college, 1 year or more education.
It is essential to understand that the correlation between the percentage of Ethiopians and percentage of population with at least college, 1 year or more education does not imply a direct cause-and-effect relationship. It remains uncertain whether the presence of Ethiopians influences an upward or downward trend in the level of percentage of population with at least college, 1 year or more education within an area, or if Ethiopians simply ended up residing in those areas with higher or lower levels of percentage of population with at least college, 1 year or more education due to other factors.
Demographics Similar to Ethiopians by College, 1 year or more
In terms of college, 1 year or more, the demographic groups most similar to Ethiopians are Paraguayan (62.9%, a difference of 0.0%), Immigrants from Lebanon (62.9%, a difference of 0.020%), Northern European (62.9%, a difference of 0.030%), Lithuanian (62.9%, a difference of 0.070%), and Armenian (63.0%, a difference of 0.10%).
| Demographics | Rating | Rank | College, 1 year or more |
| Argentineans | 99.2 /100 | #70 | Exceptional 63.2% |
| Immigrants from Canada | 99.1 /100 | #71 | Exceptional 63.1% |
| Egyptians | 99.0 /100 | #72 | Exceptional 63.1% |
| Immigrants from Moldova | 99.0 /100 | #73 | Exceptional 63.0% |
| Immigrants from North America | 99.0 /100 | #74 | Exceptional 63.0% |
| Armenians | 98.9 /100 | #75 | Exceptional 63.0% |
| Paraguayans | 98.8 /100 | #76 | Exceptional 62.9% |
| Ethiopians | 98.8 /100 | #77 | Exceptional 62.9% |
| Immigrants from Lebanon | 98.8 /100 | #78 | Exceptional 62.9% |
| Northern Europeans | 98.8 /100 | #79 | Exceptional 62.9% |
| Lithuanians | 98.8 /100 | #80 | Exceptional 62.9% |
| Laotians | 98.7 /100 | #81 | Exceptional 62.8% |
| Immigrants from Bolivia | 98.7 /100 | #82 | Exceptional 62.8% |
| Immigrants from Argentina | 98.6 /100 | #83 | Exceptional 62.8% |
| Immigrants from England | 98.6 /100 | #84 | Exceptional 62.8% |
Ethiopian College, 1 year or more Correlation Summary
| Measurement | Ethiopian Data | College, 1 year or more Data |
| Minimum | 0.064% | 42.8% |
| Maximum | 33.0% | 86.2% |
| Range | 32.9% | 43.5% |
| Mean | 6.5% | 63.2% |
| Median | 4.9% | 64.5% |
| Interquartile 25% (IQ1) | 2.5% | 57.1% |
| Interquartile 75% (IQ3) | 8.1% | 68.7% |
| Interquartile Range (IQR) | 5.6% | 11.6% |
| Standard Deviation (Sample) | 6.4% | 9.3% |
| Standard Deviation (Population) | 6.3% | 9.2% |
Correlation Details
| Ethiopian Percentile | Sample Size | College, 1 year or more |
[ 0.0% - 0.5% ] 0.064% | 143,256,012 | 58.9% |
[ 0.0% - 0.5% ] 0.22% | 34,860,374 | 62.4% |
[ 0.0% - 0.5% ] 0.40% | 14,259,429 | 63.7% |
[ 0.5% - 1.0% ] 0.56% | 7,871,315 | 64.9% |
[ 0.5% - 1.0% ] 0.74% | 3,682,371 | 64.1% |
[ 0.5% - 1.0% ] 0.91% | 3,649,545 | 65.9% |
[ 1.0% - 1.5% ] 1.08% | 2,842,926 | 65.6% |
[ 1.0% - 1.5% ] 1.21% | 2,517,692 | 67.4% |
[ 1.0% - 1.5% ] 1.41% | 1,584,290 | 68.2% |
[ 1.5% - 2.0% ] 1.56% | 1,750,526 | 63.6% |
[ 1.5% - 2.0% ] 1.73% | 964,864 | 62.6% |
[ 1.5% - 2.0% ] 1.89% | 807,230 | 63.3% |
[ 2.0% - 2.5% ] 2.07% | 384,379 | 56.8% |
[ 2.0% - 2.5% ] 2.21% | 545,179 | 65.1% |
[ 2.0% - 2.5% ] 2.39% | 176,307 | 70.0% |
[ 2.5% - 3.0% ] 2.55% | 381,336 | 65.1% |
[ 2.5% - 3.0% ] 2.73% | 263,366 | 53.8% |
[ 2.5% - 3.0% ] 2.92% | 212,401 | 66.1% |
[ 3.0% - 3.5% ] 3.00% | 469,698 | 55.0% |
[ 3.0% - 3.5% ] 3.22% | 236,713 | 66.6% |
[ 3.0% - 3.5% ] 3.38% | 286,416 | 57.4% |
[ 3.5% - 4.0% ] 3.54% | 229,912 | 65.3% |
[ 3.5% - 4.0% ] 3.65% | 62,039 | 68.6% |
[ 3.5% - 4.0% ] 3.84% | 100,273 | 49.8% |
[ 4.0% - 4.5% ] 4.03% | 156,701 | 61.0% |
[ 4.0% - 4.5% ] 4.18% | 124,288 | 63.8% |
[ 4.0% - 4.5% ] 4.36% | 78,603 | 50.0% |
[ 4.5% - 5.0% ] 4.52% | 264,356 | 75.0% |
[ 4.5% - 5.0% ] 4.71% | 48,890 | 49.1% |
[ 4.5% - 5.0% ] 4.82% | 84,569 | 60.2% |
[ 5.0% - 5.5% ] 5.03% | 132,495 | 62.9% |
[ 5.0% - 5.5% ] 5.23% | 164,741 | 57.4% |
[ 5.0% - 5.5% ] 5.33% | 55,439 | 51.2% |
[ 5.5% - 6.0% ] 5.53% | 94,052 | 49.8% |
[ 5.5% - 6.0% ] 5.69% | 26,996 | 69.0% |
[ 5.5% - 6.0% ] 5.78% | 4,017 | 52.2% |
[ 6.0% - 6.5% ] 6.02% | 26,595 | 74.9% |
[ 6.0% - 6.5% ] 6.18% | 45,072 | 83.9% |
[ 6.0% - 6.5% ] 6.33% | 44,863 | 68.8% |
[ 6.5% - 7.0% ] 6.71% | 14,098 | 76.8% |
[ 6.5% - 7.0% ] 6.89% | 61,169 | 50.4% |
[ 7.0% - 7.5% ] 7.05% | 24,581 | 51.6% |
[ 7.0% - 7.5% ] 7.28% | 101,620 | 70.8% |
[ 7.0% - 7.5% ] 7.43% | 26,573 | 67.1% |
[ 7.5% - 8.0% ] 7.74% | 18,324 | 62.0% |
[ 8.0% - 8.5% ] 8.40% | 30,927 | 49.3% |
[ 8.5% - 9.0% ] 8.52% | 587 | 86.2% |
[ 8.5% - 9.0% ] 8.65% | 64,730 | 62.4% |
[ 9.0% - 9.5% ] 9.36% | 25,823 | 65.5% |
[ 9.0% - 9.5% ] 9.44% | 50,049 | 74.8% |
[ 9.5% - 10.0% ] 9.81% | 38,318 | 67.9% |
[ 11.0% - 11.5% ] 11.38% | 5,359 | 72.9% |
[ 11.5% - 12.0% ] 11.67% | 26,684 | 42.8% |
[ 12.5% - 13.0% ] 12.73% | 1,885 | 70.2% |
[ 14.5% - 15.0% ] 14.66% | 3,514 | 65.8% |
[ 15.0% - 15.5% ] 15.16% | 4,023 | 71.4% |
[ 16.0% - 16.5% ] 16.31% | 14,553 | 44.1% |
[ 20.5% - 21.0% ] 20.66% | 121 | 49.2% |
[ 30.0% - 30.5% ] 30.48% | 105 | 73.3% |
[ 32.5% - 33.0% ] 32.97% | 182 | 75.7% |