Ethiopian Unemployment Among Women with Children Ages 6 to 17 years
COMPARE
Ethiopian
Select to Compare
Unemployment Among Women with Children Ages 6 to 17 years
Ethiopian Unemployment Among Women with Children Ages 6 to 17 years
9.0%
UNEMPLOYMENT | WOMEN W/ CHILDREN 6 TO 17
37.6/ 100
METRIC RATING
180th/ 347
METRIC RANK
Ethiopian Unemployment Among Women with Children Ages 6 to 17 years Correlation Chart
The statistical analysis conducted on geographies consisting of 181,219,006 people shows a substantial positive correlation between the proportion of Ethiopians and unemployment rate among women with children between the ages 6 and 17 in the United States with a correlation coefficient (R) of 0.512 and weighted average of 9.0%. On average, for every 1% (one percent) increase in Ethiopians within a typical geography, there is an increase of 1.8% in unemployment rate among women with children between the ages 6 and 17.
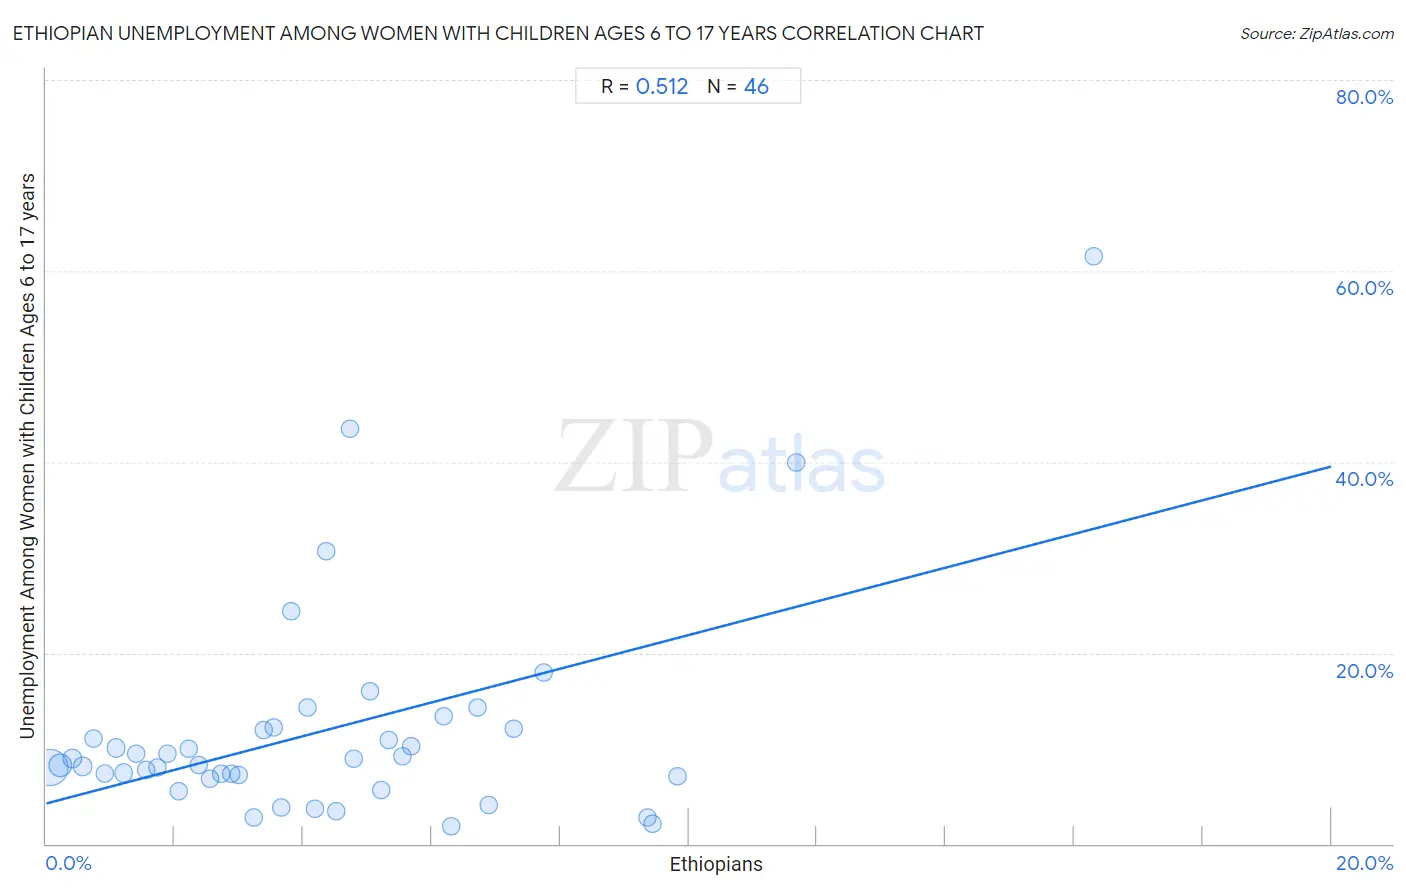
It is essential to understand that the correlation between the percentage of Ethiopians and unemployment rate among women with children between the ages 6 and 17 does not imply a direct cause-and-effect relationship. It remains uncertain whether the presence of Ethiopians influences an upward or downward trend in the level of unemployment rate among women with children between the ages 6 and 17 within an area, or if Ethiopians simply ended up residing in those areas with higher or lower levels of unemployment rate among women with children between the ages 6 and 17 due to other factors.
Demographics Similar to Ethiopians by Unemployment Among Women with Children Ages 6 to 17 years
In terms of unemployment among women with children ages 6 to 17 years, the demographic groups most similar to Ethiopians are Immigrants from Zaire (9.0%, a difference of 0.030%), Menominee (9.0%, a difference of 0.080%), Immigrants from Czechoslovakia (9.0%, a difference of 0.15%), South American Indian (9.0%, a difference of 0.16%), and Immigrants from Jordan (9.0%, a difference of 0.18%).
| Demographics | Rating | Rank | Unemployment Among Women with Children Ages 6 to 17 years |
| Immigrants from Brazil | 51.0 /100 | #173 | Average 9.0% |
| Immigrants from Costa Rica | 50.0 /100 | #174 | Average 9.0% |
| Immigrants from Sierra Leone | 45.9 /100 | #175 | Average 9.0% |
| Immigrants from Italy | 43.7 /100 | #176 | Average 9.0% |
| Immigrants from Jordan | 41.6 /100 | #177 | Average 9.0% |
| Menominee | 39.3 /100 | #178 | Fair 9.0% |
| Immigrants from Zaire | 38.3 /100 | #179 | Fair 9.0% |
| Ethiopians | 37.6 /100 | #180 | Fair 9.0% |
| Immigrants from Czechoslovakia | 34.5 /100 | #181 | Fair 9.0% |
| South American Indians | 34.4 /100 | #182 | Fair 9.0% |
| Swiss | 33.5 /100 | #183 | Fair 9.0% |
| Palestinians | 33.4 /100 | #184 | Fair 9.0% |
| Immigrants from Congo | 32.5 /100 | #185 | Fair 9.0% |
| Immigrants from Spain | 32.4 /100 | #186 | Fair 9.0% |
| Comanche | 30.0 /100 | #187 | Fair 9.0% |
Ethiopian Unemployment Among Women with Children Ages 6 to 17 years Correlation Summary
| Measurement | Ethiopian Data | Unemployment Among Women with Children Ages 6 to 17 years Data |
| Minimum | 0.064% | 1.8% |
| Maximum | 16.3% | 61.5% |
| Range | 16.2% | 59.7% |
| Mean | 4.3% | 11.8% |
| Median | 3.7% | 8.6% |
| Interquartile 25% (IQ1) | 1.9% | 7.1% |
| Interquartile 75% (IQ3) | 5.7% | 12.0% |
| Interquartile Range (IQR) | 3.8% | 4.9% |
| Standard Deviation (Sample) | 3.3% | 11.4% |
| Standard Deviation (Population) | 3.3% | 11.2% |
Correlation Details
| Ethiopian Percentile | Sample Size | Unemployment Among Women with Children Ages 6 to 17 years |
[ 0.0% - 0.5% ] 0.064% | 119,380,879 | 7.9% |
[ 0.0% - 0.5% ] 0.22% | 27,970,034 | 8.2% |
[ 0.0% - 0.5% ] 0.40% | 10,908,720 | 9.0% |
[ 0.5% - 1.0% ] 0.56% | 6,413,680 | 8.1% |
[ 0.5% - 1.0% ] 0.74% | 2,555,800 | 11.0% |
[ 0.5% - 1.0% ] 0.92% | 2,707,006 | 7.4% |
[ 1.0% - 1.5% ] 1.09% | 2,280,989 | 10.0% |
[ 1.0% - 1.5% ] 1.21% | 2,113,593 | 7.4% |
[ 1.0% - 1.5% ] 1.41% | 914,799 | 9.4% |
[ 1.5% - 2.0% ] 1.56% | 1,407,336 | 7.7% |
[ 1.5% - 2.0% ] 1.73% | 630,411 | 8.0% |
[ 1.5% - 2.0% ] 1.89% | 473,035 | 9.4% |
[ 2.0% - 2.5% ] 2.07% | 180,260 | 5.5% |
[ 2.0% - 2.5% ] 2.21% | 277,141 | 10.0% |
[ 2.0% - 2.5% ] 2.38% | 70,376 | 8.2% |
[ 2.5% - 3.0% ] 2.54% | 264,315 | 6.8% |
[ 2.5% - 3.0% ] 2.73% | 243,728 | 7.4% |
[ 2.5% - 3.0% ] 2.89% | 47,642 | 7.4% |
[ 3.0% - 3.5% ] 3.00% | 417,720 | 7.2% |
[ 3.0% - 3.5% ] 3.23% | 173,146 | 2.8% |
[ 3.0% - 3.5% ] 3.39% | 207,099 | 11.9% |
[ 3.5% - 4.0% ] 3.55% | 184,567 | 12.1% |
[ 3.5% - 4.0% ] 3.67% | 23,762 | 3.8% |
[ 3.5% - 4.0% ] 3.81% | 52,360 | 24.4% |
[ 4.0% - 4.5% ] 4.06% | 54,630 | 14.3% |
[ 4.0% - 4.5% ] 4.18% | 118,214 | 3.6% |
[ 4.0% - 4.5% ] 4.35% | 55,654 | 30.6% |
[ 4.5% - 5.0% ] 4.52% | 250,655 | 3.3% |
[ 4.5% - 5.0% ] 4.73% | 32,258 | 43.5% |
[ 4.5% - 5.0% ] 4.79% | 52,775 | 8.9% |
[ 5.0% - 5.5% ] 5.03% | 124,262 | 16.0% |
[ 5.0% - 5.5% ] 5.22% | 110,759 | 5.6% |
[ 5.0% - 5.5% ] 5.33% | 55,439 | 10.9% |
[ 5.5% - 6.0% ] 5.55% | 54,456 | 9.2% |
[ 5.5% - 6.0% ] 5.68% | 16,680 | 10.2% |
[ 6.0% - 6.5% ] 6.18% | 45,072 | 13.4% |
[ 6.0% - 6.5% ] 6.31% | 24,785 | 1.8% |
[ 6.5% - 7.0% ] 6.71% | 14,098 | 14.3% |
[ 6.5% - 7.0% ] 6.89% | 60,937 | 4.1% |
[ 7.0% - 7.5% ] 7.27% | 81,808 | 12.0% |
[ 7.5% - 8.0% ] 7.74% | 18,324 | 17.9% |
[ 9.0% - 9.5% ] 9.36% | 25,823 | 2.8% |
[ 9.0% - 9.5% ] 9.44% | 49,711 | 2.1% |
[ 9.5% - 10.0% ] 9.82% | 33,031 | 7.1% |
[ 11.5% - 12.0% ] 11.67% | 26,684 | 40.0% |
[ 16.0% - 16.5% ] 16.31% | 14,553 | 61.5% |