Ethiopian Married-Couple Family Poverty

COMPARE

Ethiopian
Race
Ancestry
AfghanAfricanAlaska NativeAlaskan AthabascanAlbanianAleutAlsatianAmericanApacheArabArapahoArgentineanArmenianAssyrian/Chaldean/SyriacAustralianAustrianBahamianBangladeshiBarbadianBasqueBelgianBelizeanBermudanBhutaneseBlackfeetBolivianBrazilianBritishBritish West IndianBulgarianBurmeseCajunCambodianCanadianCape VerdeanCarpatho RusynCelticCentral AmericanCentral American IndianCherokeeCheyenneChickasawChileanChineseChippewaChoctawColombianColvilleComancheCosta RicanCreeCreekCroatianCrowCubanCypriotCzechCzechoslovakianDanishDelawareDominicanDutchDutch West IndianEastern EuropeanEcuadorianEgyptianEnglishEstonianEthiopianEuropeanFijianFilipinoFinnishFrenchFrench American IndianFrench CanadianGermanGerman RussianGhanaianGreekGuamanian/ChamorroGuatemalanGuyaneseHaitianHmongHonduranHopiHoumaHungarianIcelanderIndian (Asian)IndonesianInupiatIranianIraqiIrishIroquoisIsraeliItalianJamaicanJapaneseJordanianKenyanKiowaKoreanLaotianLatvianLebaneseLiberianLithuanianLumbeeLuxembourgerMacedonianMalaysianMalteseMarshalleseMenomineeMexicanMexican American IndianMongolianMoroccanNative HawaiianNavajoNepaleseNew ZealanderNicaraguanNigerianNorthern EuropeanNorwegianOkinawanOsageOttawaPaiutePakistaniPalestinianPanamanianParaguayanPennsylvania GermanPeruvianPimaPolishPortuguesePotawatomiPuebloPuerto RicanPuget Sound SalishRomanianRussianSalvadoranSamoanScandinavianScotch-IrishScottishSeminoleSenegaleseSerbianShoshoneSierra LeoneanSiouxSlavicSlovakSloveneSomaliSouth AfricanSouth AmericanSouth American IndianSoviet UnionSpaniardSpanishSpanish AmericanSpanish American IndianSri LankanSubsaharan AfricanSudaneseSwedishSwissSyrianTaiwaneseThaiTlingit-HaidaTohono O'OdhamTonganTrinidadian and TobagonianTsimshianTurkishU.S. Virgin IslanderUgandanUkrainianUruguayanUteVenezuelanVietnameseWelshWest IndianYakamaYaquiYugoslavianYumanYup'ikZimbabwean
Immigration
NonimmigrantsImmigrantsAfghanistanAfricaAlbaniaArgentinaArmeniaAsiaAustraliaAustriaBahamasBangladeshBarbadosBelarusBelgiumBelizeBoliviaBosnia and HerzegovinaBrazilBulgariaBurma/MyanmarCabo VerdeCambodiaCameroonCanadaCaribbeanCentral AmericaChileChinaColombiaCongoCosta RicaCroatiaCubaCzechoslovakiaDenmarkDominicaDominican RepublicEastern AfricaEastern AsiaEastern EuropeEcuadorEgyptEl SalvadorEnglandEritreaEthiopiaEuropeFijiFranceGermanyGhanaGreeceGrenadaGuatemalaGuyanaHaitiHondurasHong KongHungaryIndiaIndonesiaIranIraqIrelandIsraelItalyJamaicaJapanJordanKazakhstanKenyaKoreaKuwaitLaosLatin AmericaLatviaLebanonLiberiaLithuaniaMalaysiaMexicoMicronesiaMiddle AfricaMoldovaMoroccoNepalNetherlandsNicaraguaNigeriaNorth AmericaNorth MacedoniaNorthern AfricaNorthern EuropeNorwayOceaniaPakistanPanamaPeruPhilippinesPolandPortugalRomaniaRussiaSaudi ArabiaScotlandSenegalSerbiaSierra LeoneSingaporeSomaliaSouth AfricaSouth AmericaSouth Central AsiaSouth Eastern AsiaSouthern EuropeSpainSri LankaSt. Vincent and the GrenadinesSudanSwedenSwitzerlandSyriaTaiwanThailandTrinidad and TobagoTurkeyUgandaUkraineUruguayUzbekistanVenezuelaVietnamWest IndiesWestern AfricaWestern AsiaWestern EuropeYemenZaireZimbabweAzores
Select to Compare
Race
Ancestry
AfghanAfricanAlaska NativeAlaskan AthabascanAlbanianAleutAlsatianAmericanApacheArabArapahoArgentineanArmenianAssyrian/Chaldean/SyriacAustralianAustrianBahamianBangladeshiBarbadianBasqueBelgianBelizeanBermudanBhutaneseBlackfeetBolivianBrazilianBritishBritish West IndianBulgarianBurmeseCajunCambodianCanadianCape VerdeanCarpatho RusynCelticCentral AmericanCentral American IndianCherokeeCheyenneChickasawChileanChineseChippewaChoctawColombianColvilleComancheCosta RicanCreeCreekCroatianCrowCubanCypriotCzechCzechoslovakianDanishDelawareDominicanDutchDutch West IndianEastern EuropeanEcuadorianEgyptianEnglishEstonianEuropeanFijianFilipinoFinnishFrenchFrench American IndianFrench CanadianGermanGerman RussianGhanaianGreekGuamanian/ChamorroGuatemalanGuyaneseHaitianHmongHonduranHopiHoumaHungarianIcelanderIndian (Asian)IndonesianInupiatIranianIraqiIrishIroquoisIsraeliItalianJamaicanJapaneseJordanianKenyanKiowaKoreanLaotianLatvianLebaneseLiberianLithuanianLumbeeLuxembourgerMacedonianMalaysianMalteseMarshalleseMenomineeMexicanMexican American IndianMongolianMoroccanNative HawaiianNavajoNepaleseNew ZealanderNicaraguanNigerianNorthern EuropeanNorwegianOkinawanOsageOttawaPaiutePakistaniPalestinianPanamanianParaguayanPennsylvania GermanPeruvianPimaPolishPortuguesePotawatomiPuebloPuerto RicanPuget Sound SalishRomanianRussianSalvadoranSamoanScandinavianScotch-IrishScottishSeminoleSenegaleseSerbianShoshoneSierra LeoneanSiouxSlavicSlovakSloveneSomaliSouth AfricanSouth AmericanSouth American IndianSoviet UnionSpaniardSpanishSpanish AmericanSpanish American IndianSri LankanSubsaharan AfricanSudaneseSwedishSwissSyrianTaiwaneseThaiTlingit-HaidaTohono O'OdhamTonganTrinidadian and TobagonianTsimshianTurkishU.S. Virgin IslanderUgandanUkrainianUruguayanUteVenezuelanVietnameseWelshWest IndianYakamaYaquiYugoslavianYumanYup'ikZimbabwean
Immigration
NonimmigrantsImmigrantsAfghanistanAfricaAlbaniaArgentinaArmeniaAsiaAustraliaAustriaBahamasBangladeshBarbadosBelarusBelgiumBelizeBoliviaBosnia and HerzegovinaBrazilBulgariaBurma/MyanmarCabo VerdeCambodiaCameroonCanadaCaribbeanCentral AmericaChileChinaColombiaCongoCosta RicaCroatiaCubaCzechoslovakiaDenmarkDominicaDominican RepublicEastern AfricaEastern AsiaEastern EuropeEcuadorEgyptEl SalvadorEnglandEritreaEthiopiaEuropeFijiFranceGermanyGhanaGreeceGrenadaGuatemalaGuyanaHaitiHondurasHong KongHungaryIndiaIndonesiaIranIraqIrelandIsraelItalyJamaicaJapanJordanKazakhstanKenyaKoreaKuwaitLaosLatin AmericaLatviaLebanonLiberiaLithuaniaMalaysiaMexicoMicronesiaMiddle AfricaMoldovaMoroccoNepalNetherlandsNicaraguaNigeriaNorth AmericaNorth MacedoniaNorthern AfricaNorthern EuropeNorwayOceaniaPakistanPanamaPeruPhilippinesPolandPortugalRomaniaRussiaSaudi ArabiaScotlandSenegalSerbiaSierra LeoneSingaporeSomaliaSouth AfricaSouth AmericaSouth Central AsiaSouth Eastern AsiaSouthern EuropeSpainSri LankaSt. Vincent and the GrenadinesSudanSwedenSwitzerlandSyriaTaiwanThailandTrinidad and TobagoTurkeyUgandaUkraineUruguayUzbekistanVenezuelaVietnamWest IndiesWestern AfricaWestern AsiaWestern EuropeYemenZaireZimbabweAzores
Married-Couple Family Poverty
Income
Poverty
Unemployment
Labor Participation
Family Structure
Vehicle Availability
Education Level
Disability

Ethiopian Married-Couple Family Poverty
Good

5.1%
POVERTY | MARRIED-COUPLE FAMILIES
68.1/ 100
METRIC RATING
161st/ 347
METRIC RANK

Ethiopian Married-Couple Family Poverty Correlation Chart

The statistical analysis conducted on geographies consisting of 222,211,608 people shows a mild positive correlation between the proportion of Ethiopians and poverty level among married-couple families in the United States with a correlation coefficient (R) of 0.393 and weighted average of 5.1%. On average, for every 1% (one percent) increase in Ethiopians within a typical geography, there is an increase of 0.41% in poverty level among married-couple families.
Ethiopian Married-Couple Family Poverty
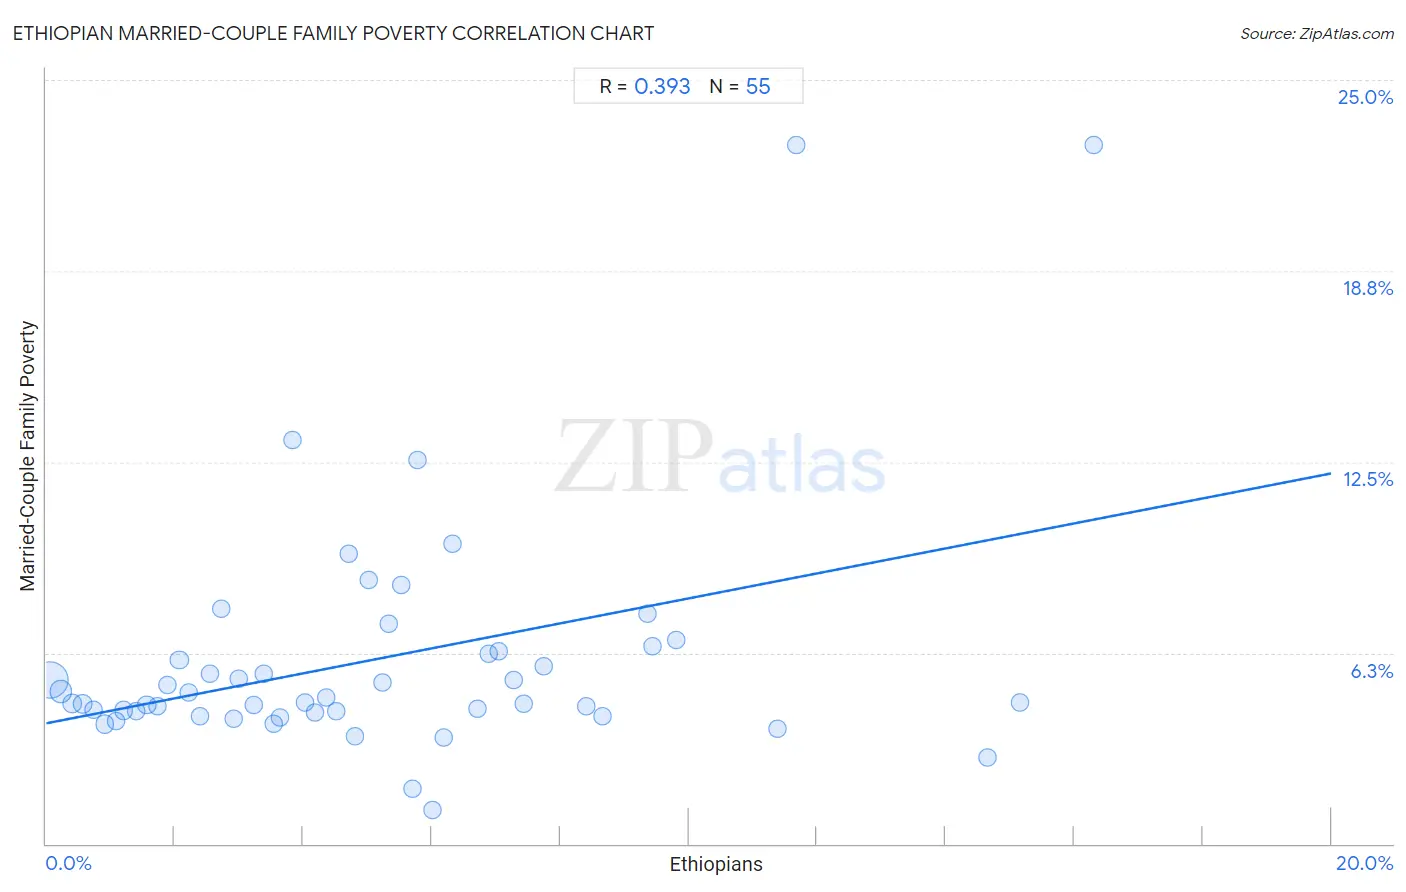
It is essential to understand that the correlation between the percentage of Ethiopians and poverty level among married-couple families does not imply a direct cause-and-effect relationship. It remains uncertain whether the presence of Ethiopians influences an upward or downward trend in the level of poverty level among married-couple families within an area, or if Ethiopians simply ended up residing in those areas with higher or lower levels of poverty level among married-couple families due to other factors.

Demographics Similar to Ethiopians by Married-Couple Family Poverty

In terms of married-couple family poverty, the demographic groups most similar to Ethiopians are Pennsylvania German (5.1%, a difference of 0.060%), Immigrants from Jordan (5.1%, a difference of 0.22%), Immigrants from South Eastern Asia (5.1%, a difference of 0.31%), Immigrants from Saudi Arabia (5.1%, a difference of 0.31%), and Argentinean (5.1%, a difference of 0.36%).
DemographicsRating | RankMarried-Couple Family Poverty
Delaware
73.7
/100
|
#154
Good
5.1%
Immigrants from Ethiopia
72.4
/100
|
#155
Good
5.1%
Sri Lankans
72.2
/100
|
#156
Good
5.1%
Argentineans
70.7
/100
|
#157
Good
5.1%
Immigrants from South Eastern Asia
70.4
/100
|
#158
Good
5.1%
Immigrants from Saudi Arabia
70.3
/100
|
#159
Good
5.1%
Pennsylvania Germans
68.5
/100
|
#160
Good
5.1%
Ethiopians
68.1
/100
|
#161
Good
5.1%
Immigrants from Jordan
66.5
/100
|
#162
Good
5.1%
Sierra Leoneans
64.1
/100
|
#163
Good
5.1%
Hawaiians
62.3
/100
|
#164
Good
5.1%
Immigrants from Malaysia
62.2
/100
|
#165
Good
5.1%
Paraguayans
61.5
/100
|
#166
Good
5.1%
Costa Ricans
61.5
/100
|
#167
Good
5.1%
Immigrants from Uganda
54.9
/100
|
#168
Average
5.2%

Ethiopian Married-Couple Family Poverty Correlation Summary

MeasurementEthiopian DataMarried-Couple Family Poverty Data
Minimum0.064%1.1%
Maximum16.3%22.9%
Range16.2%21.8%
Mean5.1%6.0%
Median4.5%4.6%
Interquartile 25% (IQ1)2.2%4.3%
Interquartile 75% (IQ3)7.0%6.3%
Interquartile Range (IQR)4.8%2.0%
Standard Deviation (Sample)3.8%4.0%
Standard Deviation (Population)3.8%3.9%

Correlation Details

Ethiopian PercentileSample SizeMarried-Couple Family Poverty
[
0.0%
-
0.5%
]
0.064%
142,858,7105.4%
[
0.0%
-
0.5%
]
0.22%
34,681,9055.0%
[
0.0%
-
0.5%
]
0.40%
14,130,2584.6%
[
0.5%
-
1.0%
]
0.56%
7,795,3244.6%
[
0.5%
-
1.0%
]
0.74%
3,651,4874.4%
[
0.5%
-
1.0%
]
0.91%
3,606,4203.9%
[
1.0%
-
1.5%
]
1.08%
2,796,0284.0%
[
1.0%
-
1.5%
]
1.21%
2,452,3544.4%
[
1.0%
-
1.5%
]
1.41%
1,579,9004.4%
[
1.5%
-
2.0%
]
1.56%
1,749,4994.6%
[
1.5%
-
2.0%
]
1.73%
962,8694.5%
[
1.5%
-
2.0%
]
1.89%
788,7195.2%
[
2.0%
-
2.5%
]
2.07%
384,3796.0%
[
2.0%
-
2.5%
]
2.21%
538,0735.0%
[
2.0%
-
2.5%
]
2.39%
159,2344.2%
[
2.5%
-
3.0%
]
2.55%
381,3365.6%
[
2.5%
-
3.0%
]
2.73%
262,2827.7%
[
2.5%
-
3.0%
]
2.92%
211,2744.1%
[
3.0%
-
3.5%
]
3.00%
465,0425.4%
[
3.0%
-
3.5%
]
3.22%
235,7834.5%
[
3.0%
-
3.5%
]
3.38%
286,4165.6%
[
3.5%
-
4.0%
]
3.54%
222,4633.9%
[
3.5%
-
4.0%
]
3.64%
57,7714.1%
[
3.5%
-
4.0%
]
3.84%
100,27313.2%
[
4.0%
-
4.5%
]
4.03%
156,7014.6%
[
4.0%
-
4.5%
]
4.18%
124,2884.3%
[
4.0%
-
4.5%
]
4.36%
73,9144.8%
[
4.5%
-
5.0%
]
4.52%
264,3564.3%
[
4.5%
-
5.0%
]
4.71%
48,8909.5%
[
4.5%
-
5.0%
]
4.82%
84,5693.5%
[
5.0%
-
5.5%
]
5.03%
130,8018.6%
[
5.0%
-
5.5%
]
5.23%
164,7415.3%
[
5.0%
-
5.5%
]
5.33%
55,4397.2%
[
5.5%
-
6.0%
]
5.53%
92,7928.5%
[
5.5%
-
6.0%
]
5.69%
26,9961.8%
[
5.5%
-
6.0%
]
5.78%
4,01712.6%
[
6.0%
-
6.5%
]
6.02%
26,5951.1%
[
6.0%
-
6.5%
]
6.18%
45,0723.5%
[
6.0%
-
6.5%
]
6.33%
44,8639.8%
[
6.5%
-
7.0%
]
6.71%
14,0984.4%
[
6.5%
-
7.0%
]
6.89%
60,9376.2%
[
7.0%
-
7.5%
]
7.05%
24,5816.3%
[
7.0%
-
7.5%
]
7.28%
101,6205.4%
[
7.0%
-
7.5%
]
7.43%
26,5734.6%
[
7.5%
-
8.0%
]
7.74%
18,3245.8%
[
8.0%
-
8.5%
]
8.40%
30,9274.5%
[
8.5%
-
9.0%
]
8.65%
64,7304.2%
[
9.0%
-
9.5%
]
9.36%
25,8237.5%
[
9.0%
-
9.5%
]
9.44%
49,7116.5%
[
9.5%
-
10.0%
]
9.81%
38,3186.7%
[
11.0%
-
11.5%
]
11.38%
5,3593.8%
[
11.5%
-
12.0%
]
11.67%
26,68422.9%
[
14.5%
-
15.0%
]
14.66%
3,5142.8%
[
15.0%
-
15.5%
]
15.16%
4,0234.6%
[
16.0%
-
16.5%
]
16.31%
14,55322.9%