Ethiopian 1 or more Vehicles in Household
COMPARE
Ethiopian
Select to Compare
1 or more Vehicles in Household
Ethiopian 1 or more Vehicles in Household
89.6%
1+ VEHICLES AVAILABLE
41.2/ 100
METRIC RATING
183rd/ 347
METRIC RANK
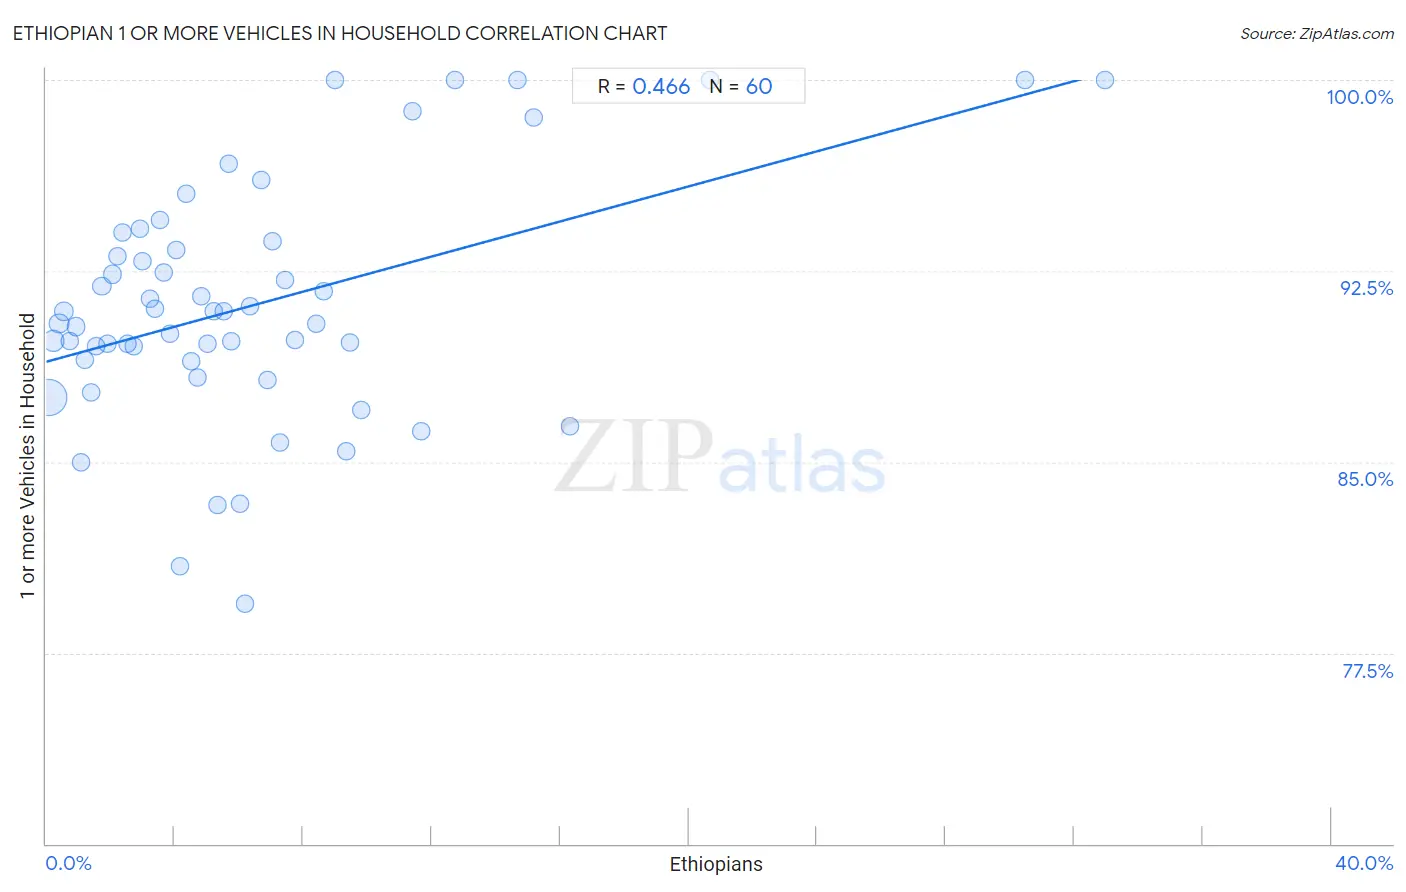
Ethiopian 1 or more Vehicles in Household Correlation Chart
The statistical analysis conducted on geographies consisting of 223,130,075 people shows a moderate positive correlation between the proportion of Ethiopians and percentage of households with 1 or more vehicles available in the United States with a correlation coefficient (R) of 0.466 and weighted average of 89.6%. On average, for every 1% (one percent) increase in Ethiopians within a typical geography, there is an increase of 0.34% in percentage of households with 1 or more vehicles available.
It is essential to understand that the correlation between the percentage of Ethiopians and percentage of households with 1 or more vehicles available does not imply a direct cause-and-effect relationship. It remains uncertain whether the presence of Ethiopians influences an upward or downward trend in the level of percentage of households with 1 or more vehicles available within an area, or if Ethiopians simply ended up residing in those areas with higher or lower levels of percentage of households with 1 or more vehicles available due to other factors.
Demographics Similar to Ethiopians by 1 or more Vehicles in Household
In terms of 1 or more vehicles in household, the demographic groups most similar to Ethiopians are Immigrants from Bulgaria (89.6%, a difference of 0.010%), Immigrants from Ethiopia (89.6%, a difference of 0.020%), Ukrainian (89.6%, a difference of 0.020%), Immigrants from Brazil (89.6%, a difference of 0.020%), and Pueblo (89.6%, a difference of 0.020%).
| Demographics | Rating | Rank | 1 or more Vehicles in Household |
| Immigrants from Sudan | 47.1 /100 | #176 | Average 89.7% |
| Hmong | 45.8 /100 | #177 | Average 89.6% |
| Immigrants from El Salvador | 44.1 /100 | #178 | Average 89.6% |
| German Russians | 44.0 /100 | #179 | Average 89.6% |
| Arabs | 43.3 /100 | #180 | Average 89.6% |
| Immigrants from Ethiopia | 42.5 /100 | #181 | Average 89.6% |
| Ukrainians | 42.4 /100 | #182 | Average 89.6% |
| Ethiopians | 41.2 /100 | #183 | Average 89.6% |
| Immigrants from Bulgaria | 40.7 /100 | #184 | Average 89.6% |
| Immigrants from Brazil | 40.1 /100 | #185 | Average 89.6% |
| Pueblo | 39.9 /100 | #186 | Fair 89.6% |
| South Americans | 39.6 /100 | #187 | Fair 89.5% |
| Immigrants from Nepal | 38.9 /100 | #188 | Fair 89.5% |
| Carpatho Rusyns | 37.8 /100 | #189 | Fair 89.5% |
| Shoshone | 37.5 /100 | #190 | Fair 89.5% |
Ethiopian 1 or more Vehicles in Household Correlation Summary
| Measurement | Ethiopian Data | 1 or more Vehicles in Household Data |
| Minimum | 0.064% | 79.4% |
| Maximum | 33.0% | 100.0% |
| Range | 32.9% | 20.6% |
| Mean | 6.5% | 91.2% |
| Median | 4.9% | 90.7% |
| Interquartile 25% (IQ1) | 2.5% | 89.0% |
| Interquartile 75% (IQ3) | 8.1% | 93.5% |
| Interquartile Range (IQR) | 5.6% | 4.5% |
| Standard Deviation (Sample) | 6.4% | 4.7% |
| Standard Deviation (Population) | 6.3% | 4.7% |
Correlation Details
| Ethiopian Percentile | Sample Size | 1 or more Vehicles in Household |
[ 0.0% - 0.5% ] 0.064% | 143,194,943 | 87.6% |
[ 0.0% - 0.5% ] 0.22% | 34,830,917 | 89.8% |
[ 0.0% - 0.5% ] 0.40% | 14,255,257 | 90.4% |
[ 0.5% - 1.0% ] 0.56% | 7,862,662 | 90.9% |
[ 0.5% - 1.0% ] 0.74% | 3,678,872 | 89.7% |
[ 0.5% - 1.0% ] 0.91% | 3,648,446 | 90.3% |
[ 1.0% - 1.5% ] 1.08% | 2,837,523 | 85.0% |
[ 1.0% - 1.5% ] 1.21% | 2,508,449 | 89.0% |
[ 1.0% - 1.5% ] 1.41% | 1,584,290 | 87.7% |
[ 1.5% - 2.0% ] 1.56% | 1,749,499 | 89.5% |
[ 1.5% - 2.0% ] 1.73% | 964,864 | 91.9% |
[ 1.5% - 2.0% ] 1.89% | 807,075 | 89.6% |
[ 2.0% - 2.5% ] 2.07% | 384,379 | 92.4% |
[ 2.0% - 2.5% ] 2.21% | 542,547 | 93.1% |
[ 2.0% - 2.5% ] 2.39% | 173,348 | 94.0% |
[ 2.5% - 3.0% ] 2.55% | 381,336 | 89.6% |
[ 2.5% - 3.0% ] 2.73% | 263,366 | 89.6% |
[ 2.5% - 3.0% ] 2.92% | 212,401 | 94.1% |
[ 3.0% - 3.5% ] 3.00% | 469,698 | 92.9% |
[ 3.0% - 3.5% ] 3.22% | 236,713 | 91.4% |
[ 3.0% - 3.5% ] 3.38% | 286,416 | 91.0% |
[ 3.5% - 4.0% ] 3.54% | 229,912 | 94.5% |
[ 3.5% - 4.0% ] 3.65% | 62,039 | 92.4% |
[ 3.5% - 4.0% ] 3.84% | 100,273 | 90.1% |
[ 4.0% - 4.5% ] 4.03% | 156,701 | 93.3% |
[ 4.0% - 4.5% ] 4.18% | 124,288 | 80.9% |
[ 4.0% - 4.5% ] 4.36% | 78,603 | 95.5% |
[ 4.5% - 5.0% ] 4.52% | 264,356 | 88.9% |
[ 4.5% - 5.0% ] 4.71% | 48,890 | 88.3% |
[ 4.5% - 5.0% ] 4.82% | 84,569 | 91.5% |
[ 5.0% - 5.5% ] 5.03% | 132,495 | 89.6% |
[ 5.0% - 5.5% ] 5.23% | 164,741 | 90.9% |
[ 5.0% - 5.5% ] 5.33% | 55,439 | 83.3% |
[ 5.5% - 6.0% ] 5.53% | 94,052 | 90.9% |
[ 5.5% - 6.0% ] 5.69% | 26,996 | 96.7% |
[ 5.5% - 6.0% ] 5.78% | 4,017 | 89.7% |
[ 6.0% - 6.5% ] 6.02% | 26,595 | 83.4% |
[ 6.0% - 6.5% ] 6.18% | 45,072 | 79.4% |
[ 6.0% - 6.5% ] 6.33% | 44,863 | 91.1% |
[ 6.5% - 7.0% ] 6.71% | 14,098 | 96.1% |
[ 6.5% - 7.0% ] 6.89% | 61,169 | 88.2% |
[ 7.0% - 7.5% ] 7.05% | 24,581 | 93.7% |
[ 7.0% - 7.5% ] 7.28% | 101,620 | 85.8% |
[ 7.0% - 7.5% ] 7.43% | 26,573 | 92.1% |
[ 7.5% - 8.0% ] 7.74% | 18,324 | 89.8% |
[ 8.0% - 8.5% ] 8.40% | 30,927 | 90.4% |
[ 8.5% - 9.0% ] 8.65% | 64,730 | 91.7% |
[ 8.5% - 9.0% ] 8.97% | 535 | 100.0% |
[ 9.0% - 9.5% ] 9.36% | 25,823 | 85.4% |
[ 9.0% - 9.5% ] 9.44% | 50,049 | 89.7% |
[ 9.5% - 10.0% ] 9.81% | 38,318 | 87.1% |
[ 11.0% - 11.5% ] 11.38% | 5,359 | 98.8% |
[ 11.5% - 12.0% ] 11.67% | 26,684 | 86.2% |
[ 12.5% - 13.0% ] 12.73% | 1,885 | 100.0% |
[ 14.5% - 15.0% ] 14.66% | 3,514 | 100.0% |
[ 15.0% - 15.5% ] 15.16% | 4,023 | 98.5% |
[ 16.0% - 16.5% ] 16.31% | 14,553 | 86.4% |
[ 20.5% - 21.0% ] 20.66% | 121 | 100.0% |
[ 30.0% - 30.5% ] 30.48% | 105 | 100.0% |
[ 32.5% - 33.0% ] 32.97% | 182 | 100.0% |