Ethiopian 4 or more Vehicles in Household
COMPARE
Ethiopian
Select to Compare
4 or more Vehicles in Household
Ethiopian 4 or more Vehicles in Household
5.8%
4+ VEHICLES AVAILABLE
3.2/ 100
METRIC RATING
244th/ 347
METRIC RANK
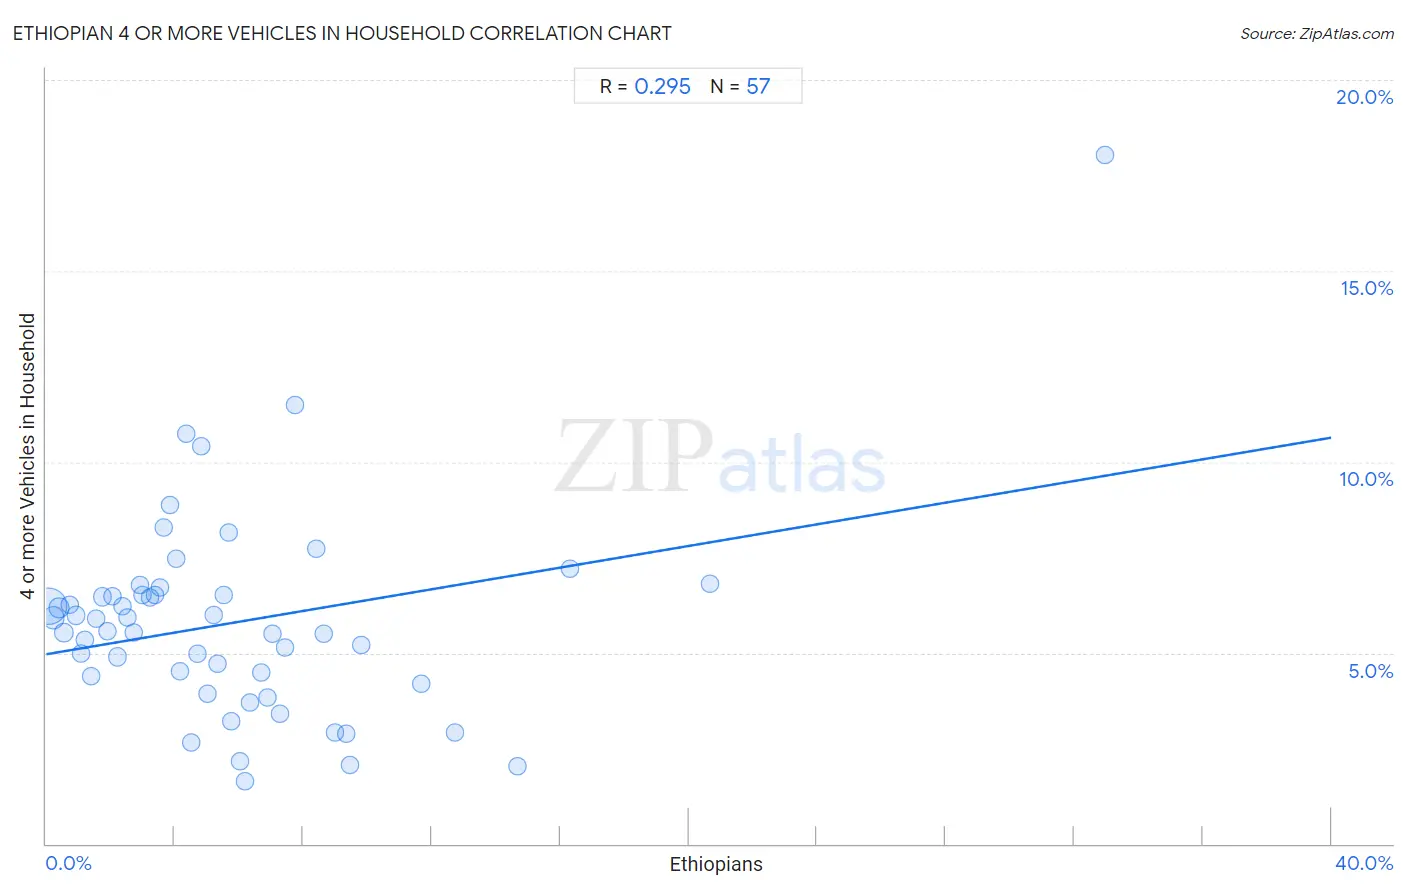
Ethiopian 4 or more Vehicles in Household Correlation Chart
The statistical analysis conducted on geographies consisting of 222,112,798 people shows a weak positive correlation between the proportion of Ethiopians and percentage of households with 4 or more vehicles available in the United States with a correlation coefficient (R) of 0.295 and weighted average of 5.8%. On average, for every 1% (one percent) increase in Ethiopians within a typical geography, there is an increase of 0.14% in percentage of households with 4 or more vehicles available.
It is essential to understand that the correlation between the percentage of Ethiopians and percentage of households with 4 or more vehicles available does not imply a direct cause-and-effect relationship. It remains uncertain whether the presence of Ethiopians influences an upward or downward trend in the level of percentage of households with 4 or more vehicles available within an area, or if Ethiopians simply ended up residing in those areas with higher or lower levels of percentage of households with 4 or more vehicles available due to other factors.
Demographics Similar to Ethiopians by 4 or more Vehicles in Household
In terms of 4 or more vehicles in household, the demographic groups most similar to Ethiopians are Immigrants from Czechoslovakia (5.8%, a difference of 0.010%), Bulgarian (5.8%, a difference of 0.040%), Immigrants from Middle Africa (5.8%, a difference of 0.20%), Mongolian (5.8%, a difference of 0.41%), and Immigrants from Poland (5.8%, a difference of 0.50%).
| Demographics | Rating | Rank | 4 or more Vehicles in Household |
| Turks | 4.1 /100 | #237 | Tragic 5.8% |
| Immigrants from Belgium | 4.0 /100 | #238 | Tragic 5.8% |
| Immigrants from Australia | 3.8 /100 | #239 | Tragic 5.8% |
| Immigrants from Poland | 3.8 /100 | #240 | Tragic 5.8% |
| Mongolians | 3.7 /100 | #241 | Tragic 5.8% |
| Immigrants from Middle Africa | 3.4 /100 | #242 | Tragic 5.8% |
| Immigrants from Czechoslovakia | 3.2 /100 | #243 | Tragic 5.8% |
| Ethiopians | 3.2 /100 | #244 | Tragic 5.8% |
| Bulgarians | 3.1 /100 | #245 | Tragic 5.8% |
| Immigrants from North Macedonia | 2.5 /100 | #246 | Tragic 5.7% |
| Immigrants from Ethiopia | 2.4 /100 | #247 | Tragic 5.7% |
| Immigrants from Eastern Africa | 2.4 /100 | #248 | Tragic 5.7% |
| Immigrants from Southern Europe | 2.3 /100 | #249 | Tragic 5.7% |
| Immigrants from Europe | 2.3 /100 | #250 | Tragic 5.7% |
| Ugandans | 2.2 /100 | #251 | Tragic 5.7% |
Ethiopian 4 or more Vehicles in Household Correlation Summary
| Measurement | Ethiopian Data | 4 or more Vehicles in Household Data |
| Minimum | 0.064% | 1.6% |
| Maximum | 33.0% | 18.0% |
| Range | 32.9% | 16.4% |
| Mean | 5.8% | 5.8% |
| Median | 4.7% | 5.6% |
| Interquartile 25% (IQ1) | 2.3% | 4.3% |
| Interquartile 75% (IQ3) | 7.4% | 6.5% |
| Interquartile Range (IQR) | 5.1% | 2.2% |
| Standard Deviation (Sample) | 5.5% | 2.7% |
| Standard Deviation (Population) | 5.5% | 2.6% |
Correlation Details
| Ethiopian Percentile | Sample Size | 4 or more Vehicles in Household |
[ 0.0% - 0.5% ] 0.064% | 142,774,771 | 6.2% |
[ 0.0% - 0.5% ] 0.22% | 34,664,301 | 5.9% |
[ 0.0% - 0.5% ] 0.40% | 14,078,500 | 6.2% |
[ 0.5% - 1.0% ] 0.56% | 7,802,899 | 5.5% |
[ 0.5% - 1.0% ] 0.74% | 3,567,528 | 6.3% |
[ 0.5% - 1.0% ] 0.91% | 3,642,326 | 6.0% |
[ 1.0% - 1.5% ] 1.08% | 2,831,717 | 5.0% |
[ 1.0% - 1.5% ] 1.21% | 2,508,449 | 5.3% |
[ 1.0% - 1.5% ] 1.41% | 1,584,290 | 4.4% |
[ 1.5% - 2.0% ] 1.56% | 1,735,097 | 5.9% |
[ 1.5% - 2.0% ] 1.73% | 944,311 | 6.5% |
[ 1.5% - 2.0% ] 1.89% | 789,747 | 5.6% |
[ 2.0% - 2.5% ] 2.07% | 383,602 | 6.5% |
[ 2.0% - 2.5% ] 2.21% | 538,073 | 4.9% |
[ 2.0% - 2.5% ] 2.39% | 173,348 | 6.2% |
[ 2.5% - 3.0% ] 2.55% | 381,336 | 5.9% |
[ 2.5% - 3.0% ] 2.73% | 261,205 | 5.5% |
[ 2.5% - 3.0% ] 2.92% | 212,126 | 6.8% |
[ 3.0% - 3.5% ] 3.00% | 469,301 | 6.5% |
[ 3.0% - 3.5% ] 3.22% | 236,713 | 6.5% |
[ 3.0% - 3.5% ] 3.38% | 286,416 | 6.5% |
[ 3.5% - 4.0% ] 3.54% | 229,912 | 6.7% |
[ 3.5% - 4.0% ] 3.65% | 62,039 | 8.3% |
[ 3.5% - 4.0% ] 3.84% | 100,273 | 8.9% |
[ 4.0% - 4.5% ] 4.03% | 156,701 | 7.5% |
[ 4.0% - 4.5% ] 4.18% | 124,288 | 4.5% |
[ 4.0% - 4.5% ] 4.36% | 78,603 | 10.7% |
[ 4.5% - 5.0% ] 4.52% | 264,356 | 2.7% |
[ 4.5% - 5.0% ] 4.71% | 48,890 | 5.0% |
[ 4.5% - 5.0% ] 4.82% | 84,569 | 10.4% |
[ 5.0% - 5.5% ] 5.03% | 132,495 | 3.9% |
[ 5.0% - 5.5% ] 5.23% | 164,741 | 6.0% |
[ 5.0% - 5.5% ] 5.33% | 55,439 | 4.7% |
[ 5.5% - 6.0% ] 5.53% | 93,545 | 6.5% |
[ 5.5% - 6.0% ] 5.69% | 26,996 | 8.1% |
[ 5.5% - 6.0% ] 5.78% | 4,017 | 3.2% |
[ 6.0% - 6.5% ] 6.02% | 26,595 | 2.2% |
[ 6.0% - 6.5% ] 6.18% | 45,072 | 1.6% |
[ 6.0% - 6.5% ] 6.33% | 44,863 | 3.7% |
[ 6.5% - 7.0% ] 6.71% | 14,098 | 4.5% |
[ 6.5% - 7.0% ] 6.89% | 61,169 | 3.8% |
[ 7.0% - 7.5% ] 7.05% | 24,581 | 5.5% |
[ 7.0% - 7.5% ] 7.28% | 101,620 | 3.4% |
[ 7.0% - 7.5% ] 7.43% | 26,573 | 5.1% |
[ 7.5% - 8.0% ] 7.74% | 18,324 | 11.5% |
[ 8.0% - 8.5% ] 8.40% | 30,927 | 7.7% |
[ 8.5% - 9.0% ] 8.65% | 64,730 | 5.5% |
[ 8.5% - 9.0% ] 8.97% | 535 | 2.9% |
[ 9.0% - 9.5% ] 9.36% | 25,823 | 2.9% |
[ 9.0% - 9.5% ] 9.44% | 49,711 | 2.1% |
[ 9.5% - 10.0% ] 9.81% | 38,318 | 5.2% |
[ 11.5% - 12.0% ] 11.67% | 26,684 | 4.2% |
[ 12.5% - 13.0% ] 12.73% | 1,885 | 2.9% |
[ 14.5% - 15.0% ] 14.66% | 3,514 | 2.0% |
[ 16.0% - 16.5% ] 16.31% | 14,553 | 7.2% |
[ 20.5% - 21.0% ] 20.66% | 121 | 6.8% |
[ 32.5% - 33.0% ] 32.97% | 182 | 18.0% |