Ethiopian Self-Care Disability

COMPARE

Ethiopian
Race
Ancestry
AfghanAfricanAlaska NativeAlaskan AthabascanAlbanianAleutAlsatianAmericanApacheArabArapahoArgentineanArmenianAssyrian/Chaldean/SyriacAustralianAustrianBahamianBangladeshiBarbadianBasqueBelgianBelizeanBermudanBhutaneseBlackfeetBolivianBrazilianBritishBritish West IndianBulgarianBurmeseCajunCambodianCanadianCape VerdeanCarpatho RusynCelticCentral AmericanCentral American IndianCherokeeCheyenneChickasawChileanChineseChippewaChoctawColombianColvilleComancheCosta RicanCreeCreekCroatianCrowCubanCypriotCzechCzechoslovakianDanishDelawareDominicanDutchDutch West IndianEastern EuropeanEcuadorianEgyptianEnglishEstonianEthiopianEuropeanFijianFilipinoFinnishFrenchFrench American IndianFrench CanadianGermanGerman RussianGhanaianGreekGuamanian/ChamorroGuatemalanGuyaneseHaitianHmongHonduranHopiHoumaHungarianIcelanderIndian (Asian)IndonesianInupiatIranianIraqiIrishIroquoisIsraeliItalianJamaicanJapaneseJordanianKenyanKiowaKoreanLaotianLatvianLebaneseLiberianLithuanianLumbeeLuxembourgerMacedonianMalaysianMalteseMarshalleseMenomineeMexicanMexican American IndianMongolianMoroccanNative HawaiianNavajoNepaleseNew ZealanderNicaraguanNigerianNorthern EuropeanNorwegianOkinawanOsageOttawaPaiutePakistaniPalestinianPanamanianParaguayanPennsylvania GermanPeruvianPimaPolishPortuguesePotawatomiPuebloPuerto RicanPuget Sound SalishRomanianRussianSalvadoranSamoanScandinavianScotch-IrishScottishSeminoleSenegaleseSerbianShoshoneSierra LeoneanSiouxSlavicSlovakSloveneSomaliSouth AfricanSouth AmericanSouth American IndianSoviet UnionSpaniardSpanishSpanish AmericanSpanish American IndianSri LankanSubsaharan AfricanSudaneseSwedishSwissSyrianTaiwaneseThaiTlingit-HaidaTohono O'OdhamTonganTrinidadian and TobagonianTsimshianTurkishU.S. Virgin IslanderUgandanUkrainianUruguayanUteVenezuelanVietnameseWelshWest IndianYakamaYaquiYugoslavianYumanYup'ikZimbabwean
Immigration
NonimmigrantsImmigrantsAfghanistanAfricaAlbaniaArgentinaArmeniaAsiaAustraliaAustriaBahamasBangladeshBarbadosBelarusBelgiumBelizeBoliviaBosnia and HerzegovinaBrazilBulgariaBurma/MyanmarCabo VerdeCambodiaCameroonCanadaCaribbeanCentral AmericaChileChinaColombiaCongoCosta RicaCroatiaCubaCzechoslovakiaDenmarkDominicaDominican RepublicEastern AfricaEastern AsiaEastern EuropeEcuadorEgyptEl SalvadorEnglandEritreaEthiopiaEuropeFijiFranceGermanyGhanaGreeceGrenadaGuatemalaGuyanaHaitiHondurasHong KongHungaryIndiaIndonesiaIranIraqIrelandIsraelItalyJamaicaJapanJordanKazakhstanKenyaKoreaKuwaitLaosLatin AmericaLatviaLebanonLiberiaLithuaniaMalaysiaMexicoMicronesiaMiddle AfricaMoldovaMoroccoNepalNetherlandsNicaraguaNigeriaNorth AmericaNorth MacedoniaNorthern AfricaNorthern EuropeNorwayOceaniaPakistanPanamaPeruPhilippinesPolandPortugalRomaniaRussiaSaudi ArabiaScotlandSenegalSerbiaSierra LeoneSingaporeSomaliaSouth AfricaSouth AmericaSouth Central AsiaSouth Eastern AsiaSouthern EuropeSpainSri LankaSt. Vincent and the GrenadinesSudanSwedenSwitzerlandSyriaTaiwanThailandTrinidad and TobagoTurkeyUgandaUkraineUruguayUzbekistanVenezuelaVietnamWest IndiesWestern AfricaWestern AsiaWestern EuropeYemenZaireZimbabweAzores
Select to Compare
Race
Ancestry
AfghanAfricanAlaska NativeAlaskan AthabascanAlbanianAleutAlsatianAmericanApacheArabArapahoArgentineanArmenianAssyrian/Chaldean/SyriacAustralianAustrianBahamianBangladeshiBarbadianBasqueBelgianBelizeanBermudanBhutaneseBlackfeetBolivianBrazilianBritishBritish West IndianBulgarianBurmeseCajunCambodianCanadianCape VerdeanCarpatho RusynCelticCentral AmericanCentral American IndianCherokeeCheyenneChickasawChileanChineseChippewaChoctawColombianColvilleComancheCosta RicanCreeCreekCroatianCrowCubanCypriotCzechCzechoslovakianDanishDelawareDominicanDutchDutch West IndianEastern EuropeanEcuadorianEgyptianEnglishEstonianEuropeanFijianFilipinoFinnishFrenchFrench American IndianFrench CanadianGermanGerman RussianGhanaianGreekGuamanian/ChamorroGuatemalanGuyaneseHaitianHmongHonduranHopiHoumaHungarianIcelanderIndian (Asian)IndonesianInupiatIranianIraqiIrishIroquoisIsraeliItalianJamaicanJapaneseJordanianKenyanKiowaKoreanLaotianLatvianLebaneseLiberianLithuanianLumbeeLuxembourgerMacedonianMalaysianMalteseMarshalleseMenomineeMexicanMexican American IndianMongolianMoroccanNative HawaiianNavajoNepaleseNew ZealanderNicaraguanNigerianNorthern EuropeanNorwegianOkinawanOsageOttawaPaiutePakistaniPalestinianPanamanianParaguayanPennsylvania GermanPeruvianPimaPolishPortuguesePotawatomiPuebloPuerto RicanPuget Sound SalishRomanianRussianSalvadoranSamoanScandinavianScotch-IrishScottishSeminoleSenegaleseSerbianShoshoneSierra LeoneanSiouxSlavicSlovakSloveneSomaliSouth AfricanSouth AmericanSouth American IndianSoviet UnionSpaniardSpanishSpanish AmericanSpanish American IndianSri LankanSubsaharan AfricanSudaneseSwedishSwissSyrianTaiwaneseThaiTlingit-HaidaTohono O'OdhamTonganTrinidadian and TobagonianTsimshianTurkishU.S. Virgin IslanderUgandanUkrainianUruguayanUteVenezuelanVietnameseWelshWest IndianYakamaYaquiYugoslavianYumanYup'ikZimbabwean
Immigration
NonimmigrantsImmigrantsAfghanistanAfricaAlbaniaArgentinaArmeniaAsiaAustraliaAustriaBahamasBangladeshBarbadosBelarusBelgiumBelizeBoliviaBosnia and HerzegovinaBrazilBulgariaBurma/MyanmarCabo VerdeCambodiaCameroonCanadaCaribbeanCentral AmericaChileChinaColombiaCongoCosta RicaCroatiaCubaCzechoslovakiaDenmarkDominicaDominican RepublicEastern AfricaEastern AsiaEastern EuropeEcuadorEgyptEl SalvadorEnglandEritreaEthiopiaEuropeFijiFranceGermanyGhanaGreeceGrenadaGuatemalaGuyanaHaitiHondurasHong KongHungaryIndiaIndonesiaIranIraqIrelandIsraelItalyJamaicaJapanJordanKazakhstanKenyaKoreaKuwaitLaosLatin AmericaLatviaLebanonLiberiaLithuaniaMalaysiaMexicoMicronesiaMiddle AfricaMoldovaMoroccoNepalNetherlandsNicaraguaNigeriaNorth AmericaNorth MacedoniaNorthern AfricaNorthern EuropeNorwayOceaniaPakistanPanamaPeruPhilippinesPolandPortugalRomaniaRussiaSaudi ArabiaScotlandSenegalSerbiaSierra LeoneSingaporeSomaliaSouth AfricaSouth AmericaSouth Central AsiaSouth Eastern AsiaSouthern EuropeSpainSri LankaSt. Vincent and the GrenadinesSudanSwedenSwitzerlandSyriaTaiwanThailandTrinidad and TobagoTurkeyUgandaUkraineUruguayUzbekistanVenezuelaVietnamWest IndiesWestern AfricaWestern AsiaWestern EuropeYemenZaireZimbabweAzores
Self-Care Disability
Income
Poverty
Unemployment
Labor Participation
Family Structure
Vehicle Availability
Education Level
Disability

Ethiopian Self-Care Disability
Exceptional

2.2%
SELF-CARE DISABILITY
100.0/ 100
METRIC RATING
13th/ 347
METRIC RANK

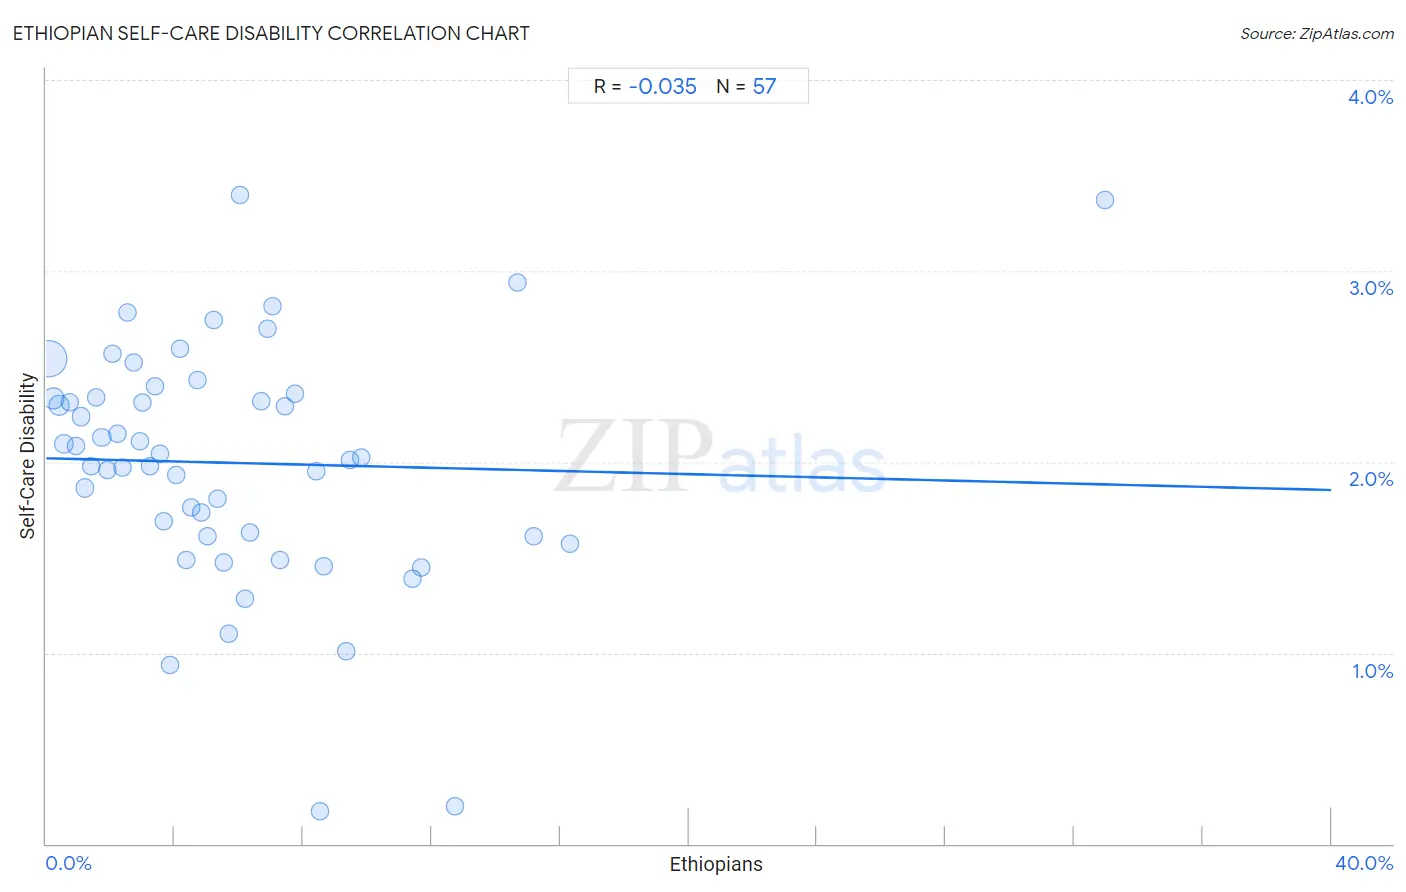
Ethiopian Self-Care Disability Correlation Chart

The statistical analysis conducted on geographies consisting of 223,073,982 people shows no correlation between the proportion of Ethiopians and percentage of population with self-care disability in the United States with a correlation coefficient (R) of -0.035 and weighted average of 2.2%. On average, for every 1% (one percent) increase in Ethiopians within a typical geography, there is a decrease of 0.0041% in percentage of population with self-care disability.
Ethiopian Self-Care Disability
It is essential to understand that the correlation between the percentage of Ethiopians and percentage of population with self-care disability does not imply a direct cause-and-effect relationship. It remains uncertain whether the presence of Ethiopians influences an upward or downward trend in the level of percentage of population with self-care disability within an area, or if Ethiopians simply ended up residing in those areas with higher or lower levels of percentage of population with self-care disability due to other factors.

Demographics Similar to Ethiopians by Self-Care Disability

In terms of self-care disability, the demographic groups most similar to Ethiopians are Immigrants from Ethiopia (2.2%, a difference of 0.010%), Immigrants from South Central Asia (2.2%, a difference of 0.070%), Luxembourger (2.2%, a difference of 0.16%), Sudanese (2.2%, a difference of 0.17%), and Okinawan (2.2%, a difference of 0.17%).
DemographicsRating | RankSelf-Care Disability
Filipinos
100.0
/100
|
#6
Exceptional
2.2%
Immigrants from Bolivia
100.0
/100
|
#7
Exceptional
2.2%
Bolivians
100.0
/100
|
#8
Exceptional
2.2%
Immigrants from Nepal
100.0
/100
|
#9
Exceptional
2.2%
Sudanese
100.0
/100
|
#10
Exceptional
2.2%
Immigrants from South Central Asia
100.0
/100
|
#11
Exceptional
2.2%
Immigrants from Ethiopia
100.0
/100
|
#12
Exceptional
2.2%
Ethiopians
100.0
/100
|
#13
Exceptional
2.2%
Luxembourgers
100.0
/100
|
#14
Exceptional
2.2%
Okinawans
100.0
/100
|
#15
Exceptional
2.2%
Immigrants from Kuwait
100.0
/100
|
#16
Exceptional
2.2%
Immigrants from Saudi Arabia
100.0
/100
|
#17
Exceptional
2.2%
Immigrants from Taiwan
100.0
/100
|
#18
Exceptional
2.2%
Immigrants from Eritrea
100.0
/100
|
#19
Exceptional
2.2%
Tongans
100.0
/100
|
#20
Exceptional
2.2%

Ethiopian Self-Care Disability Correlation Summary

MeasurementEthiopian DataSelf-Care Disability Data
Minimum0.064%0.17%
Maximum33.0%3.4%
Range32.9%3.2%
Mean5.8%2.0%
Median4.7%2.0%
Interquartile 25% (IQ1)2.3%1.6%
Interquartile 75% (IQ3)7.6%2.3%
Interquartile Range (IQR)5.3%0.74%
Standard Deviation (Sample)5.3%0.63%
Standard Deviation (Population)5.3%0.63%

Correlation Details

Ethiopian PercentileSample SizeSelf-Care Disability
[
0.0%
-
0.5%
]
0.064%
143,191,0642.5%
[
0.0%
-
0.5%
]
0.22%
34,823,5602.3%
[
0.0%
-
0.5%
]
0.40%
14,241,1722.3%
[
0.5%
-
1.0%
]
0.56%
7,841,3092.1%
[
0.5%
-
1.0%
]
0.74%
3,675,6132.3%
[
0.5%
-
1.0%
]
0.91%
3,648,4462.1%
[
1.0%
-
1.5%
]
1.08%
2,831,7172.2%
[
1.0%
-
1.5%
]
1.21%
2,516,0461.9%
[
1.0%
-
1.5%
]
1.41%
1,579,8792.0%
[
1.5%
-
2.0%
]
1.56%
1,748,8092.3%
[
1.5%
-
2.0%
]
1.73%
964,8642.1%
[
1.5%
-
2.0%
]
1.89%
807,0752.0%
[
2.0%
-
2.5%
]
2.07%
384,0982.6%
[
2.0%
-
2.5%
]
2.21%
545,1792.1%
[
2.0%
-
2.5%
]
2.39%
173,3482.0%
[
2.5%
-
3.0%
]
2.55%
381,3362.8%
[
2.5%
-
3.0%
]
2.73%
263,3662.5%
[
2.5%
-
3.0%
]
2.92%
212,4012.1%
[
3.0%
-
3.5%
]
3.00%
469,6982.3%
[
3.0%
-
3.5%
]
3.22%
236,1262.0%
[
3.0%
-
3.5%
]
3.38%
286,4162.4%
[
3.5%
-
4.0%
]
3.54%
229,9122.0%
[
3.5%
-
4.0%
]
3.65%
62,0391.7%
[
3.5%
-
4.0%
]
3.84%
100,2730.93%
[
4.0%
-
4.5%
]
4.03%
156,7011.9%
[
4.0%
-
4.5%
]
4.18%
124,2882.6%
[
4.0%
-
4.5%
]
4.36%
78,6031.5%
[
4.5%
-
5.0%
]
4.52%
264,3561.8%
[
4.5%
-
5.0%
]
4.71%
48,8902.4%
[
4.5%
-
5.0%
]
4.82%
84,5691.7%
[
5.0%
-
5.5%
]
5.03%
132,4951.6%
[
5.0%
-
5.5%
]
5.23%
164,5502.7%
[
5.0%
-
5.5%
]
5.33%
55,4391.8%
[
5.5%
-
6.0%
]
5.53%
94,0521.5%
[
5.5%
-
6.0%
]
5.69%
26,9961.1%
[
6.0%
-
6.5%
]
6.02%
26,5953.4%
[
6.0%
-
6.5%
]
6.18%
45,0721.3%
[
6.0%
-
6.5%
]
6.33%
44,8631.6%
[
6.5%
-
7.0%
]
6.71%
14,0982.3%
[
6.5%
-
7.0%
]
6.89%
60,9372.7%
[
7.0%
-
7.5%
]
7.05%
24,5812.8%
[
7.0%
-
7.5%
]
7.28%
101,6201.5%
[
7.0%
-
7.5%
]
7.43%
26,5732.3%
[
7.5%
-
8.0%
]
7.74%
18,3242.4%
[
8.0%
-
8.5%
]
8.40%
30,9271.9%
[
8.5%
-
9.0%
]
8.52%
5870.17%
[
8.5%
-
9.0%
]
8.65%
64,7301.5%
[
9.0%
-
9.5%
]
9.36%
25,8231.0%
[
9.0%
-
9.5%
]
9.44%
50,0492.0%
[
9.5%
-
10.0%
]
9.81%
38,3182.0%
[
11.0%
-
11.5%
]
11.38%
5,3591.4%
[
11.5%
-
12.0%
]
11.67%
26,6841.4%
[
12.5%
-
13.0%
]
12.73%
1,8850.20%
[
14.5%
-
15.0%
]
14.66%
3,5142.9%
[
15.0%
-
15.5%
]
15.16%
4,0231.6%
[
16.0%
-
16.5%
]
16.31%
14,5531.6%
[
32.5%
-
33.0%
]
32.97%
1823.4%