Creek Unemployment Among Women with Children Ages 6 to 17 years

COMPARE

Creek
Race
Ancestry
AfghanAfricanAlaska NativeAlaskan AthabascanAlbanianAleutAlsatianAmericanApacheArabArapahoArgentineanArmenianAssyrian/Chaldean/SyriacAustralianAustrianBahamianBangladeshiBarbadianBasqueBelgianBelizeanBermudanBhutaneseBlackfeetBolivianBrazilianBritishBritish West IndianBulgarianBurmeseCajunCambodianCanadianCape VerdeanCarpatho RusynCelticCentral AmericanCentral American IndianCherokeeCheyenneChickasawChileanChineseChippewaChoctawColombianColvilleComancheCosta RicanCreeCreekCroatianCrowCubanCypriotCzechCzechoslovakianDanishDelawareDominicanDutchDutch West IndianEastern EuropeanEcuadorianEgyptianEnglishEstonianEthiopianEuropeanFijianFilipinoFinnishFrenchFrench American IndianFrench CanadianGermanGerman RussianGhanaianGreekGuamanian/ChamorroGuatemalanGuyaneseHaitianHmongHonduranHopiHoumaHungarianIcelanderIndian (Asian)IndonesianInupiatIranianIraqiIrishIroquoisIsraeliItalianJamaicanJapaneseJordanianKenyanKiowaKoreanLaotianLatvianLebaneseLiberianLithuanianLumbeeLuxembourgerMacedonianMalaysianMalteseMarshalleseMenomineeMexicanMexican American IndianMongolianMoroccanNative HawaiianNavajoNepaleseNew ZealanderNicaraguanNigerianNorthern EuropeanNorwegianOkinawanOsageOttawaPaiutePakistaniPalestinianPanamanianParaguayanPennsylvania GermanPeruvianPimaPolishPortuguesePotawatomiPuebloPuerto RicanPuget Sound SalishRomanianRussianSalvadoranSamoanScandinavianScotch-IrishScottishSeminoleSenegaleseSerbianShoshoneSierra LeoneanSiouxSlavicSlovakSloveneSomaliSouth AfricanSouth AmericanSouth American IndianSoviet UnionSpaniardSpanishSpanish AmericanSpanish American IndianSri LankanSubsaharan AfricanSudaneseSwedishSwissSyrianTaiwaneseThaiTlingit-HaidaTohono O'OdhamTonganTrinidadian and TobagonianTsimshianTurkishU.S. Virgin IslanderUgandanUkrainianUruguayanUteVenezuelanVietnameseWelshWest IndianYakamaYaquiYugoslavianYumanYup'ikZimbabwean
Immigration
NonimmigrantsImmigrantsAfghanistanAfricaAlbaniaArgentinaArmeniaAsiaAustraliaAustriaBahamasBangladeshBarbadosBelarusBelgiumBelizeBoliviaBosnia and HerzegovinaBrazilBulgariaBurma/MyanmarCabo VerdeCambodiaCameroonCanadaCaribbeanCentral AmericaChileChinaColombiaCongoCosta RicaCroatiaCubaCzechoslovakiaDenmarkDominicaDominican RepublicEastern AfricaEastern AsiaEastern EuropeEcuadorEgyptEl SalvadorEnglandEritreaEthiopiaEuropeFijiFranceGermanyGhanaGreeceGrenadaGuatemalaGuyanaHaitiHondurasHong KongHungaryIndiaIndonesiaIranIraqIrelandIsraelItalyJamaicaJapanJordanKazakhstanKenyaKoreaKuwaitLaosLatin AmericaLatviaLebanonLiberiaLithuaniaMalaysiaMexicoMicronesiaMiddle AfricaMoldovaMoroccoNepalNetherlandsNicaraguaNigeriaNorth AmericaNorth MacedoniaNorthern AfricaNorthern EuropeNorwayOceaniaPakistanPanamaPeruPhilippinesPolandPortugalRomaniaRussiaSaudi ArabiaScotlandSenegalSerbiaSierra LeoneSingaporeSomaliaSouth AfricaSouth AmericaSouth Central AsiaSouth Eastern AsiaSouthern EuropeSpainSri LankaSt. Vincent and the GrenadinesSudanSwedenSwitzerlandSyriaTaiwanThailandTrinidad and TobagoTurkeyUgandaUkraineUruguayUzbekistanVenezuelaVietnamWest IndiesWestern AfricaWestern AsiaWestern EuropeYemenZaireZimbabweAzores
Select to Compare
Race
Ancestry
AfghanAfricanAlaska NativeAlaskan AthabascanAlbanianAleutAlsatianAmericanApacheArabArapahoArgentineanArmenianAssyrian/Chaldean/SyriacAustralianAustrianBahamianBangladeshiBarbadianBasqueBelgianBelizeanBermudanBhutaneseBlackfeetBolivianBrazilianBritishBritish West IndianBulgarianBurmeseCajunCambodianCanadianCape VerdeanCarpatho RusynCelticCentral AmericanCentral American IndianCherokeeCheyenneChickasawChileanChineseChippewaChoctawColombianColvilleComancheCosta RicanCreeCroatianCrowCubanCypriotCzechCzechoslovakianDanishDelawareDominicanDutchDutch West IndianEastern EuropeanEcuadorianEgyptianEnglishEstonianEthiopianEuropeanFijianFilipinoFinnishFrenchFrench American IndianFrench CanadianGermanGerman RussianGhanaianGreekGuamanian/ChamorroGuatemalanGuyaneseHaitianHmongHonduranHopiHoumaHungarianIcelanderIndian (Asian)IndonesianInupiatIranianIraqiIrishIroquoisIsraeliItalianJamaicanJapaneseJordanianKenyanKiowaKoreanLaotianLatvianLebaneseLiberianLithuanianLumbeeLuxembourgerMacedonianMalaysianMalteseMarshalleseMenomineeMexicanMexican American IndianMongolianMoroccanNative HawaiianNavajoNepaleseNew ZealanderNicaraguanNigerianNorthern EuropeanNorwegianOkinawanOsageOttawaPaiutePakistaniPalestinianPanamanianParaguayanPennsylvania GermanPeruvianPimaPolishPortuguesePotawatomiPuebloPuerto RicanPuget Sound SalishRomanianRussianSalvadoranSamoanScandinavianScotch-IrishScottishSeminoleSenegaleseSerbianShoshoneSierra LeoneanSiouxSlavicSlovakSloveneSomaliSouth AfricanSouth AmericanSouth American IndianSoviet UnionSpaniardSpanishSpanish AmericanSpanish American IndianSri LankanSubsaharan AfricanSudaneseSwedishSwissSyrianTaiwaneseThaiTlingit-HaidaTohono O'OdhamTonganTrinidadian and TobagonianTsimshianTurkishU.S. Virgin IslanderUgandanUkrainianUruguayanUteVenezuelanVietnameseWelshWest IndianYakamaYaquiYugoslavianYumanYup'ikZimbabwean
Immigration
NonimmigrantsImmigrantsAfghanistanAfricaAlbaniaArgentinaArmeniaAsiaAustraliaAustriaBahamasBangladeshBarbadosBelarusBelgiumBelizeBoliviaBosnia and HerzegovinaBrazilBulgariaBurma/MyanmarCabo VerdeCambodiaCameroonCanadaCaribbeanCentral AmericaChileChinaColombiaCongoCosta RicaCroatiaCubaCzechoslovakiaDenmarkDominicaDominican RepublicEastern AfricaEastern AsiaEastern EuropeEcuadorEgyptEl SalvadorEnglandEritreaEthiopiaEuropeFijiFranceGermanyGhanaGreeceGrenadaGuatemalaGuyanaHaitiHondurasHong KongHungaryIndiaIndonesiaIranIraqIrelandIsraelItalyJamaicaJapanJordanKazakhstanKenyaKoreaKuwaitLaosLatin AmericaLatviaLebanonLiberiaLithuaniaMalaysiaMexicoMicronesiaMiddle AfricaMoldovaMoroccoNepalNetherlandsNicaraguaNigeriaNorth AmericaNorth MacedoniaNorthern AfricaNorthern EuropeNorwayOceaniaPakistanPanamaPeruPhilippinesPolandPortugalRomaniaRussiaSaudi ArabiaScotlandSenegalSerbiaSierra LeoneSingaporeSomaliaSouth AfricaSouth AmericaSouth Central AsiaSouth Eastern AsiaSouthern EuropeSpainSri LankaSt. Vincent and the GrenadinesSudanSwedenSwitzerlandSyriaTaiwanThailandTrinidad and TobagoTurkeyUgandaUkraineUruguayUzbekistanVenezuelaVietnamWest IndiesWestern AfricaWestern AsiaWestern EuropeYemenZaireZimbabweAzores
Unemployment Among Women with Children Ages 6 to 17 years
Income
Poverty
Unemployment
Labor Participation
Family Structure
Vehicle Availability
Education Level
Disability

Creek Unemployment Among Women with Children Ages 6 to 17 years
Tragic

9.4%
UNEMPLOYMENT | WOMEN W/ CHILDREN 6 TO 17
1.2/ 100
METRIC RATING
252nd/ 347
METRIC RANK

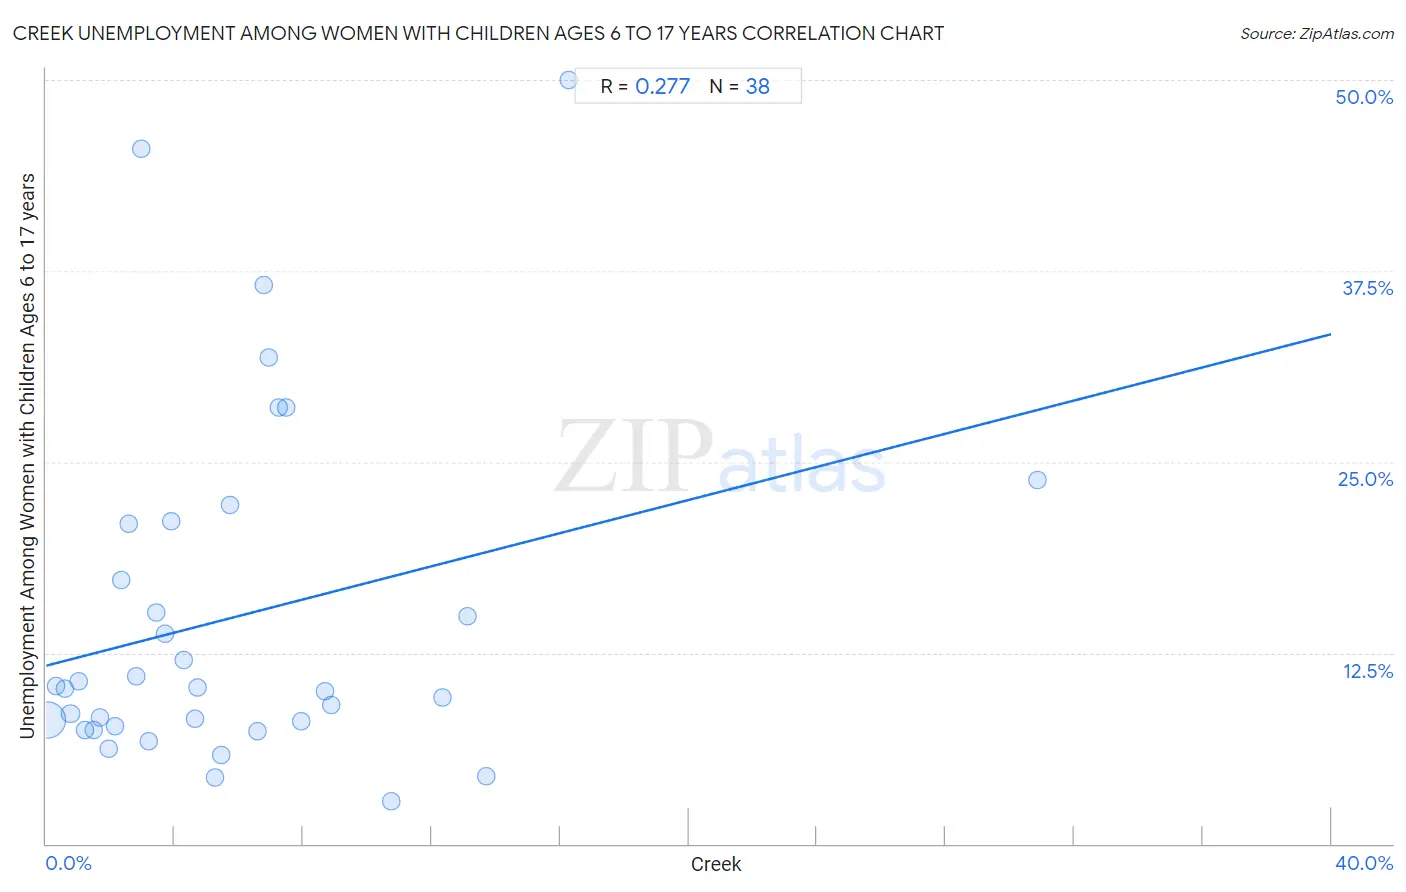
Creek Unemployment Among Women with Children Ages 6 to 17 years Correlation Chart

The statistical analysis conducted on geographies consisting of 148,406,734 people shows a weak positive correlation between the proportion of Creek and unemployment rate among women with children between the ages 6 and 17 in the United States with a correlation coefficient (R) of 0.277 and weighted average of 9.4%. On average, for every 1% (one percent) increase in Creek within a typical geography, there is an increase of 0.54% in unemployment rate among women with children between the ages 6 and 17.
Creek Unemployment Among Women with Children Ages 6 to 17 years
It is essential to understand that the correlation between the percentage of Creek and unemployment rate among women with children between the ages 6 and 17 does not imply a direct cause-and-effect relationship. It remains uncertain whether the presence of Creek influences an upward or downward trend in the level of unemployment rate among women with children between the ages 6 and 17 within an area, or if Creek simply ended up residing in those areas with higher or lower levels of unemployment rate among women with children between the ages 6 and 17 due to other factors.

Demographics Similar to Creek by Unemployment Among Women with Children Ages 6 to 17 years

In terms of unemployment among women with children ages 6 to 17 years, the demographic groups most similar to Creek are Central American (9.4%, a difference of 0.090%), Portuguese (9.4%, a difference of 0.090%), Immigrants from Guatemala (9.4%, a difference of 0.11%), Immigrants from South America (9.4%, a difference of 0.19%), and Dutch (9.4%, a difference of 0.20%).
DemographicsRating | RankUnemployment Among Women with Children Ages 6 to 17 years
Immigrants from Cameroon
1.8
/100
|
#245
Tragic
9.4%
Immigrants from Africa
1.6
/100
|
#246
Tragic
9.4%
Poles
1.5
/100
|
#247
Tragic
9.4%
Dutch
1.5
/100
|
#248
Tragic
9.4%
Immigrants from South America
1.5
/100
|
#249
Tragic
9.4%
Immigrants from Guatemala
1.3
/100
|
#250
Tragic
9.4%
Central Americans
1.3
/100
|
#251
Tragic
9.4%
Creek
1.2
/100
|
#252
Tragic
9.4%
Portuguese
1.1
/100
|
#253
Tragic
9.4%
Nicaraguans
1.0
/100
|
#254
Tragic
9.4%
Lithuanians
0.9
/100
|
#255
Tragic
9.4%
Canadians
0.8
/100
|
#256
Tragic
9.4%
Celtics
0.7
/100
|
#257
Tragic
9.5%
Immigrants from Mexico
0.7
/100
|
#258
Tragic
9.5%
Immigrants from Central America
0.6
/100
|
#259
Tragic
9.5%

Creek Unemployment Among Women with Children Ages 6 to 17 years Correlation Summary

MeasurementCreek DataUnemployment Among Women with Children Ages 6 to 17 years Data
Minimum0.033%2.8%
Maximum30.8%50.0%
Range30.8%47.2%
Mean5.9%14.9%
Median4.5%10.2%
Interquartile 25% (IQ1)2.1%7.7%
Interquartile 75% (IQ3)7.5%21.0%
Interquartile Range (IQR)5.3%13.3%
Standard Deviation (Sample)5.8%11.3%
Standard Deviation (Population)5.7%11.2%

Correlation Details

Creek PercentileSample SizeUnemployment Among Women with Children Ages 6 to 17 years
[
0.0%
-
0.5%
]
0.033%
140,777,7638.1%
[
0.0%
-
0.5%
]
0.30%
3,130,46810.3%
[
0.5%
-
1.0%
]
0.58%
1,695,14710.2%
[
0.5%
-
1.0%
]
0.76%
693,5938.5%
[
1.0%
-
1.5%
]
1.01%
251,95210.6%
[
1.0%
-
1.5%
]
1.20%
292,2457.4%
[
1.0%
-
1.5%
]
1.49%
203,2547.5%
[
1.5%
-
2.0%
]
1.69%
466,7968.3%
[
1.5%
-
2.0%
]
1.94%
323,6826.2%
[
2.0%
-
2.5%
]
2.15%
40,8317.7%
[
2.0%
-
2.5%
]
2.35%
46,81417.2%
[
2.5%
-
3.0%
]
2.56%
78,92821.0%
[
2.5%
-
3.0%
]
2.81%
52,73810.9%
[
2.5%
-
3.0%
]
2.95%
5,56545.5%
[
3.0%
-
3.5%
]
3.19%
49,3096.7%
[
3.0%
-
3.5%
]
3.44%
32,26815.2%
[
3.5%
-
4.0%
]
3.70%
14,60413.7%
[
3.5%
-
4.0%
]
3.89%
53,33521.1%
[
4.0%
-
4.5%
]
4.29%
24,92212.1%
[
4.5%
-
5.0%
]
4.63%
20,1728.2%
[
4.5%
-
5.0%
]
4.70%
22,24010.2%
[
5.0%
-
5.5%
]
5.24%
4,5414.3%
[
5.0%
-
5.5%
]
5.44%
22,0305.8%
[
5.5%
-
6.0%
]
5.71%
40322.2%
[
6.5%
-
7.0%
]
6.56%
32,0987.3%
[
6.5%
-
7.0%
]
6.76%
3,21236.5%
[
6.5%
-
7.0%
]
6.92%
5,57831.8%
[
7.0%
-
7.5%
]
7.23%
31828.6%
[
7.0%
-
7.5%
]
7.46%
1,12628.6%
[
7.5%
-
8.0%
]
7.95%
13,6298.0%
[
8.5%
-
9.0%
]
8.68%
1,60210.0%
[
8.5%
-
9.0%
]
8.88%
1,3519.1%
[
10.5%
-
11.0%
]
10.73%
5,6392.8%
[
12.0%
-
12.5%
]
12.33%
15,2129.6%
[
13.0%
-
13.5%
]
13.11%
11,36614.9%
[
13.5%
-
14.0%
]
13.70%
9,1484.4%
[
16.0%
-
16.5%
]
16.27%
37550.0%
[
30.5%
-
31.0%
]
30.85%
2,48023.8%