Creek Disability
COMPARE
Creek
Select to Compare
Disability
Creek Disability
15.6%
DISABILITY
0.0/ 100
METRIC RATING
343rd/ 347
METRIC RANK
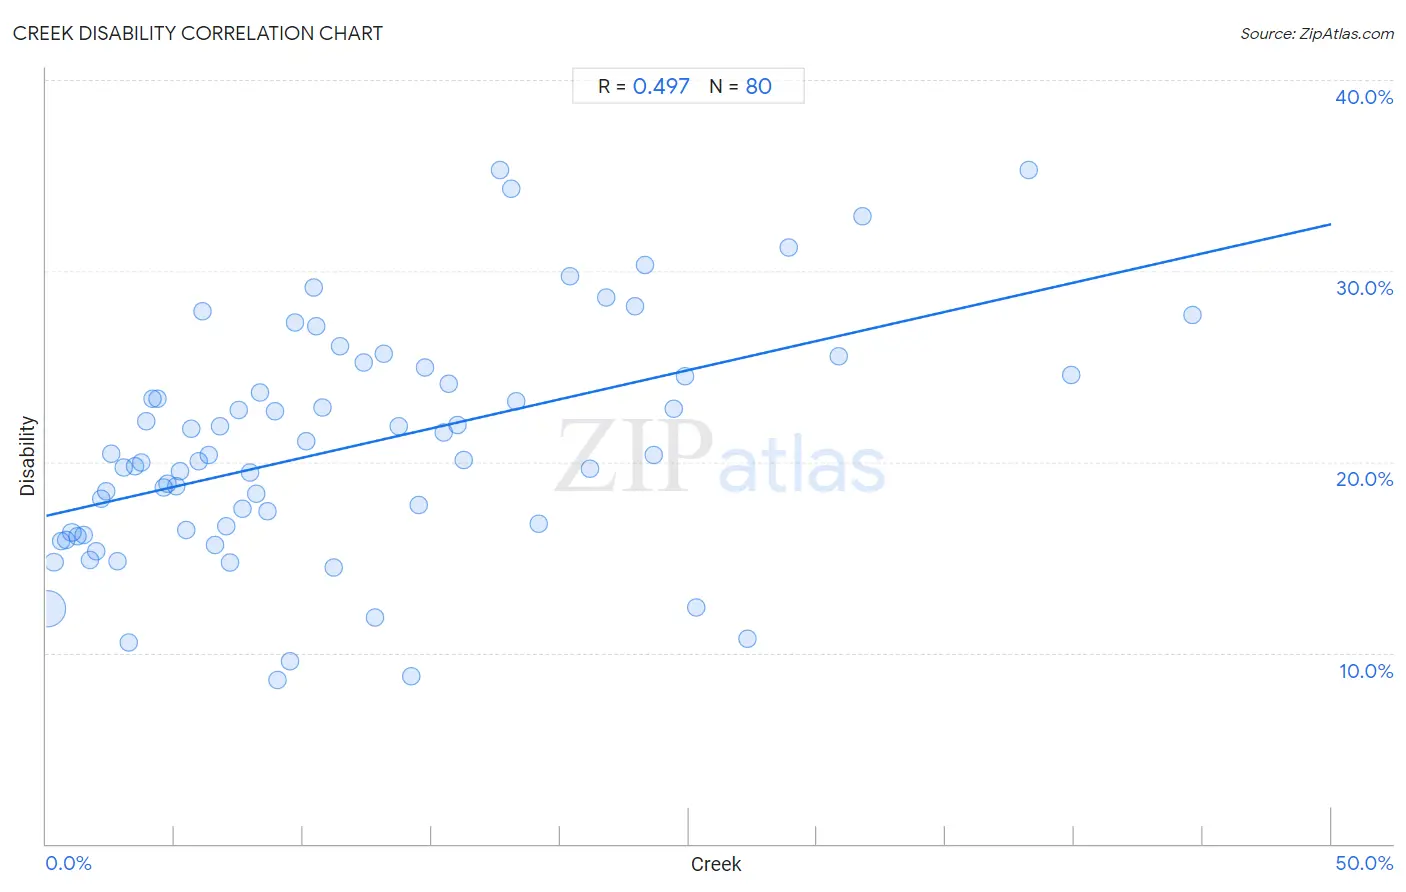
Creek Disability Correlation Chart
The statistical analysis conducted on geographies consisting of 178,460,797 people shows a moderate positive correlation between the proportion of Creek and percentage of population with a disability in the United States with a correlation coefficient (R) of 0.497 and weighted average of 15.6%. On average, for every 1% (one percent) increase in Creek within a typical geography, there is an increase of 0.31% in percentage of population with a disability.
It is essential to understand that the correlation between the percentage of Creek and percentage of population with a disability does not imply a direct cause-and-effect relationship. It remains uncertain whether the presence of Creek influences an upward or downward trend in the level of percentage of population with a disability within an area, or if Creek simply ended up residing in those areas with higher or lower levels of percentage of population with a disability due to other factors.
Demographics Similar to Creek by Disability
In terms of disability, the demographic groups most similar to Creek are Kiowa (15.6%, a difference of 0.010%), Lumbee (15.5%, a difference of 0.47%), Colville (15.8%, a difference of 1.2%), Choctaw (15.4%, a difference of 1.3%), and Chickasaw (15.2%, a difference of 2.8%).
| Demographics | Rating | Rank | Disability |
| Cajuns | 0.0 /100 | #333 | Tragic 14.6% |
| Yuman | 0.0 /100 | #334 | Tragic 14.6% |
| Tohono O'odham | 0.0 /100 | #335 | Tragic 14.8% |
| Cherokee | 0.0 /100 | #336 | Tragic 14.8% |
| Seminole | 0.0 /100 | #337 | Tragic 14.9% |
| Dutch West Indians | 0.0 /100 | #338 | Tragic 14.9% |
| Chickasaw | 0.0 /100 | #339 | Tragic 15.2% |
| Choctaw | 0.0 /100 | #340 | Tragic 15.4% |
| Lumbee | 0.0 /100 | #341 | Tragic 15.5% |
| Kiowa | 0.0 /100 | #342 | Tragic 15.6% |
| Creek | 0.0 /100 | #343 | Tragic 15.6% |
| Colville | 0.0 /100 | #344 | Tragic 15.8% |
| Puerto Ricans | 0.0 /100 | #345 | Tragic 16.1% |
| Tsimshian | 0.0 /100 | #346 | Tragic 16.1% |
| Houma | 0.0 /100 | #347 | Tragic 17.1% |
Creek Disability Correlation Summary
| Measurement | Creek Data | Disability Data |
| Minimum | 0.037% | 8.6% |
| Maximum | 44.6% | 35.3% |
| Range | 44.5% | 26.7% |
| Mean | 11.9% | 20.8% |
| Median | 9.0% | 20.2% |
| Interquartile 25% (IQ1) | 4.4% | 16.4% |
| Interquartile 75% (IQ3) | 17.0% | 24.5% |
| Interquartile Range (IQR) | 12.5% | 8.1% |
| Standard Deviation (Sample) | 9.9% | 6.1% |
| Standard Deviation (Population) | 9.8% | 6.0% |
Correlation Details
| Creek Percentile | Sample Size | Disability |
[ 0.0% - 0.5% ] 0.037% | 165,681,999 | 12.3% |
[ 0.0% - 0.5% ] 0.31% | 5,465,706 | 14.8% |
[ 0.5% - 1.0% ] 0.57% | 2,578,153 | 15.8% |
[ 0.5% - 1.0% ] 0.75% | 1,135,579 | 15.9% |
[ 0.5% - 1.0% ] 1.00% | 555,772 | 16.3% |
[ 1.0% - 1.5% ] 1.21% | 567,294 | 16.1% |
[ 1.0% - 1.5% ] 1.48% | 425,907 | 16.2% |
[ 1.5% - 2.0% ] 1.69% | 543,018 | 14.9% |
[ 1.5% - 2.0% ] 1.93% | 433,319 | 15.3% |
[ 2.0% - 2.5% ] 2.14% | 87,585 | 18.1% |
[ 2.0% - 2.5% ] 2.33% | 127,266 | 18.5% |
[ 2.5% - 3.0% ] 2.55% | 104,272 | 20.5% |
[ 2.5% - 3.0% ] 2.76% | 150,431 | 14.8% |
[ 3.0% - 3.5% ] 3.02% | 24,270 | 19.7% |
[ 3.0% - 3.5% ] 3.19% | 63,433 | 10.5% |
[ 3.0% - 3.5% ] 3.44% | 49,223 | 19.7% |
[ 3.5% - 4.0% ] 3.70% | 23,138 | 20.0% |
[ 3.5% - 4.0% ] 3.88% | 61,064 | 22.1% |
[ 4.0% - 4.5% ] 4.12% | 9,988 | 23.3% |
[ 4.0% - 4.5% ] 4.31% | 31,427 | 23.3% |
[ 4.5% - 5.0% ] 4.59% | 34,437 | 18.7% |
[ 4.5% - 5.0% ] 4.71% | 24,563 | 18.9% |
[ 5.0% - 5.5% ] 5.05% | 752 | 18.7% |
[ 5.0% - 5.5% ] 5.23% | 8,038 | 19.5% |
[ 5.0% - 5.5% ] 5.44% | 23,323 | 16.4% |
[ 5.5% - 6.0% ] 5.64% | 2,996 | 21.7% |
[ 5.5% - 6.0% ] 5.94% | 758 | 20.1% |
[ 6.0% - 6.5% ] 6.07% | 1,120 | 27.9% |
[ 6.0% - 6.5% ] 6.34% | 1,262 | 20.4% |
[ 6.5% - 7.0% ] 6.59% | 42,642 | 15.6% |
[ 6.5% - 7.0% ] 6.74% | 21,074 | 21.9% |
[ 7.0% - 7.5% ] 7.03% | 20,475 | 16.6% |
[ 7.0% - 7.5% ] 7.17% | 17,879 | 14.7% |
[ 7.0% - 7.5% ] 7.48% | 15,295 | 22.7% |
[ 7.5% - 8.0% ] 7.64% | 7,093 | 17.6% |
[ 7.5% - 8.0% ] 7.94% | 17,750 | 19.4% |
[ 8.0% - 8.5% ] 8.17% | 4,602 | 18.3% |
[ 8.0% - 8.5% ] 8.33% | 1,393 | 23.6% |
[ 8.5% - 9.0% ] 8.62% | 2,934 | 17.4% |
[ 8.5% - 9.0% ] 8.89% | 3,128 | 22.7% |
[ 9.0% - 9.5% ] 9.02% | 1,286 | 8.6% |
[ 9.0% - 9.5% ] 9.49% | 2,572 | 9.6% |
[ 9.5% - 10.0% ] 9.69% | 227 | 27.3% |
[ 10.0% - 10.5% ] 10.13% | 9,131 | 21.1% |
[ 10.0% - 10.5% ] 10.41% | 3,181 | 29.1% |
[ 10.5% - 11.0% ] 10.53% | 247 | 27.1% |
[ 10.5% - 11.0% ] 10.73% | 5,639 | 22.8% |
[ 11.0% - 11.5% ] 11.18% | 152 | 14.5% |
[ 11.0% - 11.5% ] 11.41% | 368 | 26.1% |
[ 12.0% - 12.5% ] 12.33% | 15,212 | 25.2% |
[ 12.5% - 13.0% ] 12.80% | 1,086 | 11.9% |
[ 13.0% - 13.5% ] 13.11% | 11,366 | 25.7% |
[ 13.5% - 14.0% ] 13.70% | 9,396 | 21.9% |
[ 14.0% - 14.5% ] 14.21% | 183 | 8.7% |
[ 14.5% - 15.0% ] 14.52% | 124 | 17.7% |
[ 14.5% - 15.0% ] 14.75% | 373 | 24.9% |
[ 15.0% - 15.5% ] 15.46% | 2,419 | 21.5% |
[ 15.5% - 16.0% ] 15.65% | 3,048 | 24.1% |
[ 15.5% - 16.0% ] 15.98% | 2,828 | 22.0% |
[ 16.0% - 16.5% ] 16.27% | 375 | 20.1% |
[ 17.5% - 18.0% ] 17.65% | 119 | 35.3% |
[ 18.0% - 18.5% ] 18.10% | 210 | 34.3% |
[ 18.0% - 18.5% ] 18.29% | 328 | 23.2% |
[ 19.0% - 19.5% ] 19.18% | 245 | 16.7% |
[ 20.0% - 20.5% ] 20.36% | 894 | 29.8% |
[ 21.0% - 21.5% ] 21.15% | 6,000 | 19.6% |
[ 21.5% - 22.0% ] 21.77% | 951 | 28.6% |
[ 22.5% - 23.0% ] 22.92% | 192 | 28.1% |
[ 23.0% - 23.5% ] 23.27% | 739 | 30.3% |
[ 23.5% - 24.0% ] 23.66% | 3,373 | 20.3% |
[ 24.0% - 24.5% ] 24.41% | 1,815 | 22.8% |
[ 24.5% - 25.0% ] 24.86% | 1,070 | 24.5% |
[ 25.0% - 25.5% ] 25.31% | 162 | 12.3% |
[ 27.0% - 27.5% ] 27.27% | 121 | 10.7% |
[ 28.5% - 29.0% ] 28.91% | 128 | 31.2% |
[ 30.5% - 31.0% ] 30.85% | 2,480 | 25.5% |
[ 31.5% - 32.0% ] 31.77% | 447 | 32.9% |
[ 38.0% - 38.5% ] 38.25% | 1,498 | 35.3% |
[ 39.5% - 40.0% ] 39.89% | 371 | 24.5% |
[ 44.5% - 45.0% ] 44.58% | 83 | 27.7% |