Creek College, Under 1 year
COMPARE
Creek
Select to Compare
College, Under 1 year
Creek College, Under 1 year
59.3%
COLLEGE, UNDER 1 YEAR
0.0/ 100
METRIC RATING
291st/ 347
METRIC RANK
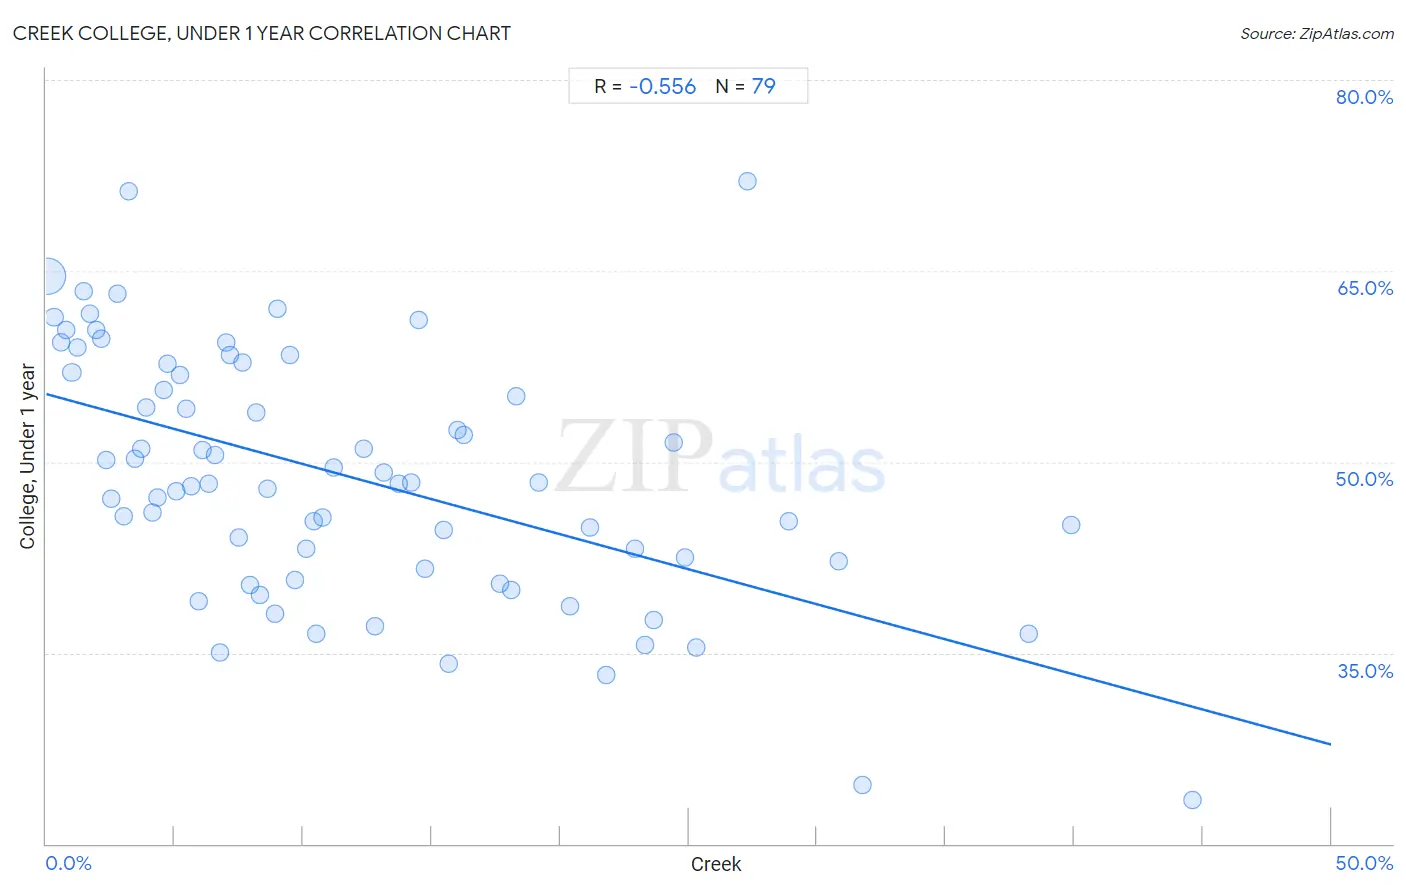
Creek College, Under 1 year Correlation Chart
The statistical analysis conducted on geographies consisting of 178,480,346 people shows a substantial negative correlation between the proportion of Creek and percentage of population with at least college, under 1 year education in the United States with a correlation coefficient (R) of -0.556 and weighted average of 59.3%. On average, for every 1% (one percent) increase in Creek within a typical geography, there is a decrease of 0.55% in percentage of population with at least college, under 1 year education.
It is essential to understand that the correlation between the percentage of Creek and percentage of population with at least college, under 1 year education does not imply a direct cause-and-effect relationship. It remains uncertain whether the presence of Creek influences an upward or downward trend in the level of percentage of population with at least college, under 1 year education within an area, or if Creek simply ended up residing in those areas with higher or lower levels of percentage of population with at least college, under 1 year education due to other factors.
Demographics Similar to Creek by College, Under 1 year
In terms of college, under 1 year, the demographic groups most similar to Creek are Nicaraguan (59.2%, a difference of 0.040%), Ecuadorian (59.3%, a difference of 0.090%), Choctaw (59.3%, a difference of 0.13%), Black/African American (59.4%, a difference of 0.20%), and Seminole (59.1%, a difference of 0.23%).
| Demographics | Rating | Rank | College, Under 1 year |
| Immigrants from St. Vincent and the Grenadines | 0.0 /100 | #284 | Tragic 59.6% |
| Paiute | 0.0 /100 | #285 | Tragic 59.6% |
| British West Indians | 0.0 /100 | #286 | Tragic 59.5% |
| Sioux | 0.0 /100 | #287 | Tragic 59.4% |
| Blacks/African Americans | 0.0 /100 | #288 | Tragic 59.4% |
| Choctaw | 0.0 /100 | #289 | Tragic 59.3% |
| Ecuadorians | 0.0 /100 | #290 | Tragic 59.3% |
| Creek | 0.0 /100 | #291 | Tragic 59.3% |
| Nicaraguans | 0.0 /100 | #292 | Tragic 59.2% |
| Seminole | 0.0 /100 | #293 | Tragic 59.1% |
| Immigrants from Belize | 0.0 /100 | #294 | Tragic 59.1% |
| Immigrants from Grenada | 0.0 /100 | #295 | Tragic 59.1% |
| Central American Indians | 0.0 /100 | #296 | Tragic 59.0% |
| Guyanese | 0.0 /100 | #297 | Tragic 59.0% |
| Immigrants from Ecuador | 0.0 /100 | #298 | Tragic 58.7% |
Creek College, Under 1 year Correlation Summary
| Measurement | Creek Data | College, Under 1 year Data |
| Minimum | 0.037% | 23.4% |
| Maximum | 44.6% | 72.1% |
| Range | 44.5% | 48.7% |
| Mean | 11.9% | 48.8% |
| Median | 8.9% | 48.2% |
| Interquartile 25% (IQ1) | 4.3% | 41.6% |
| Interquartile 75% (IQ3) | 17.6% | 57.0% |
| Interquartile Range (IQR) | 13.3% | 15.4% |
| Standard Deviation (Sample) | 10.0% | 9.9% |
| Standard Deviation (Population) | 9.9% | 9.8% |
Correlation Details
| Creek Percentile | Sample Size | College, Under 1 year |
[ 0.0% - 0.5% ] 0.037% | 165,699,174 | 64.6% |
[ 0.0% - 0.5% ] 0.31% | 5,464,929 | 61.4% |
[ 0.5% - 1.0% ] 0.57% | 2,578,153 | 59.4% |
[ 0.5% - 1.0% ] 0.75% | 1,136,762 | 60.4% |
[ 0.5% - 1.0% ] 1.00% | 557,854 | 57.0% |
[ 1.0% - 1.5% ] 1.21% | 567,462 | 59.0% |
[ 1.0% - 1.5% ] 1.48% | 425,907 | 63.4% |
[ 1.5% - 2.0% ] 1.69% | 543,018 | 61.7% |
[ 1.5% - 2.0% ] 1.93% | 433,319 | 60.4% |
[ 2.0% - 2.5% ] 2.14% | 87,585 | 59.7% |
[ 2.0% - 2.5% ] 2.33% | 127,266 | 50.2% |
[ 2.5% - 3.0% ] 2.55% | 104,272 | 47.1% |
[ 2.5% - 3.0% ] 2.76% | 150,540 | 63.2% |
[ 3.0% - 3.5% ] 3.02% | 24,270 | 45.7% |
[ 3.0% - 3.5% ] 3.19% | 63,433 | 71.2% |
[ 3.0% - 3.5% ] 3.44% | 49,223 | 50.2% |
[ 3.5% - 4.0% ] 3.70% | 23,138 | 51.0% |
[ 3.5% - 4.0% ] 3.88% | 61,064 | 54.3% |
[ 4.0% - 4.5% ] 4.12% | 9,988 | 46.0% |
[ 4.0% - 4.5% ] 4.31% | 31,427 | 47.2% |
[ 4.5% - 5.0% ] 4.59% | 34,437 | 55.7% |
[ 4.5% - 5.0% ] 4.71% | 24,563 | 57.7% |
[ 5.0% - 5.5% ] 5.05% | 752 | 47.7% |
[ 5.0% - 5.5% ] 5.23% | 8,038 | 56.8% |
[ 5.0% - 5.5% ] 5.44% | 23,323 | 54.2% |
[ 5.5% - 6.0% ] 5.64% | 2,996 | 48.1% |
[ 5.5% - 6.0% ] 5.94% | 758 | 39.1% |
[ 6.0% - 6.5% ] 6.07% | 1,120 | 51.0% |
[ 6.0% - 6.5% ] 6.34% | 1,262 | 48.2% |
[ 6.5% - 7.0% ] 6.59% | 42,642 | 50.5% |
[ 6.5% - 7.0% ] 6.74% | 21,074 | 35.0% |
[ 7.0% - 7.5% ] 7.03% | 20,475 | 59.4% |
[ 7.0% - 7.5% ] 7.17% | 17,879 | 58.4% |
[ 7.0% - 7.5% ] 7.48% | 15,295 | 44.1% |
[ 7.5% - 8.0% ] 7.64% | 7,093 | 57.8% |
[ 7.5% - 8.0% ] 7.94% | 17,750 | 40.3% |
[ 8.0% - 8.5% ] 8.17% | 4,602 | 53.8% |
[ 8.0% - 8.5% ] 8.33% | 1,393 | 39.5% |
[ 8.5% - 9.0% ] 8.62% | 2,934 | 47.9% |
[ 8.5% - 9.0% ] 8.89% | 3,105 | 38.1% |
[ 9.0% - 9.5% ] 9.02% | 1,286 | 62.0% |
[ 9.0% - 9.5% ] 9.49% | 2,572 | 58.4% |
[ 9.5% - 10.0% ] 9.69% | 227 | 40.8% |
[ 10.0% - 10.5% ] 10.13% | 9,131 | 43.2% |
[ 10.0% - 10.5% ] 10.41% | 3,181 | 45.3% |
[ 10.5% - 11.0% ] 10.53% | 247 | 36.5% |
[ 10.5% - 11.0% ] 10.73% | 5,639 | 45.6% |
[ 11.0% - 11.5% ] 11.18% | 152 | 49.5% |
[ 12.0% - 12.5% ] 12.33% | 15,212 | 51.0% |
[ 12.5% - 13.0% ] 12.80% | 1,086 | 37.1% |
[ 13.0% - 13.5% ] 13.11% | 11,366 | 49.2% |
[ 13.5% - 14.0% ] 13.70% | 9,396 | 48.2% |
[ 14.0% - 14.5% ] 14.21% | 183 | 48.4% |
[ 14.5% - 15.0% ] 14.52% | 124 | 61.1% |
[ 14.5% - 15.0% ] 14.75% | 373 | 41.6% |
[ 15.0% - 15.5% ] 15.46% | 2,419 | 44.7% |
[ 15.5% - 16.0% ] 15.65% | 3,048 | 34.1% |
[ 15.5% - 16.0% ] 15.98% | 2,828 | 52.5% |
[ 16.0% - 16.5% ] 16.27% | 375 | 52.1% |
[ 17.5% - 18.0% ] 17.65% | 119 | 40.4% |
[ 18.0% - 18.5% ] 18.10% | 210 | 39.9% |
[ 18.0% - 18.5% ] 18.29% | 328 | 55.1% |
[ 19.0% - 19.5% ] 19.18% | 245 | 48.3% |
[ 20.0% - 20.5% ] 20.36% | 894 | 38.7% |
[ 21.0% - 21.5% ] 21.15% | 6,000 | 44.8% |
[ 21.5% - 22.0% ] 21.77% | 951 | 33.2% |
[ 22.5% - 23.0% ] 22.92% | 192 | 43.2% |
[ 23.0% - 23.5% ] 23.27% | 739 | 35.6% |
[ 23.5% - 24.0% ] 23.66% | 3,373 | 37.5% |
[ 24.0% - 24.5% ] 24.41% | 1,815 | 51.5% |
[ 24.5% - 25.0% ] 24.86% | 1,070 | 42.5% |
[ 25.0% - 25.5% ] 25.31% | 162 | 35.4% |
[ 27.0% - 27.5% ] 27.27% | 121 | 72.1% |
[ 28.5% - 29.0% ] 28.91% | 128 | 45.4% |
[ 30.5% - 31.0% ] 30.85% | 2,480 | 42.2% |
[ 31.5% - 32.0% ] 31.77% | 447 | 24.6% |
[ 38.0% - 38.5% ] 38.25% | 1,498 | 36.5% |
[ 39.5% - 40.0% ] 39.89% | 371 | 45.0% |
[ 44.5% - 45.0% ] 44.58% | 83 | 23.4% |