Creek 3 or more Vehicles in Household
COMPARE
Creek
Select to Compare
3 or more Vehicles in Household
Creek 3 or more Vehicles in Household
21.9%
3+ VEHICLES AVAILABLE
99.9/ 100
METRIC RATING
69th/ 347
METRIC RANK
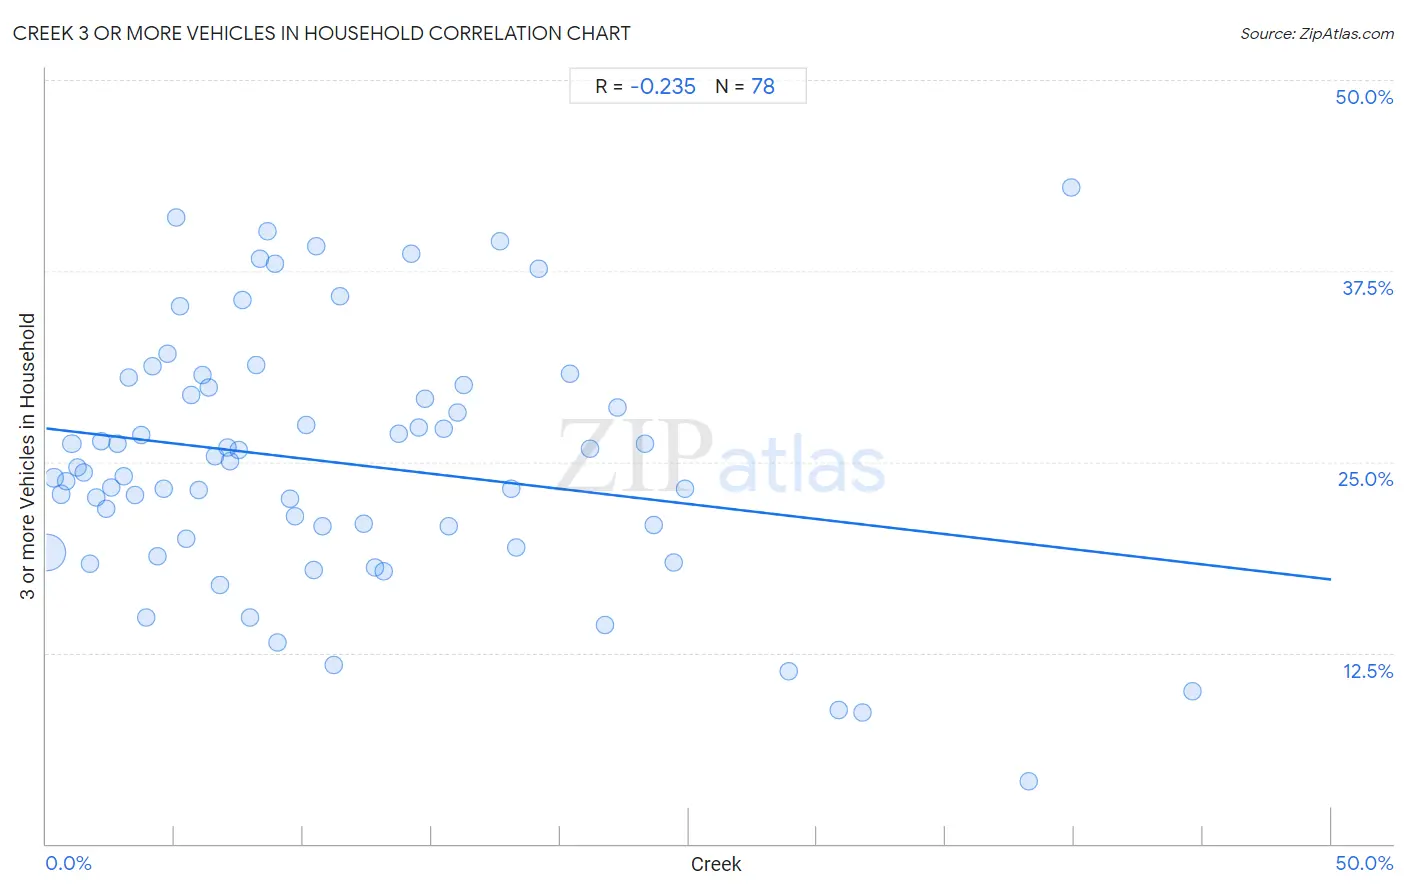
Creek 3 or more Vehicles in Household Correlation Chart
The statistical analysis conducted on geographies consisting of 178,435,403 people shows a weak negative correlation between the proportion of Creek and percentage of households with 3 or more vehicles available in the United States with a correlation coefficient (R) of -0.235 and weighted average of 21.9%. On average, for every 1% (one percent) increase in Creek within a typical geography, there is a decrease of 0.20% in percentage of households with 3 or more vehicles available.
It is essential to understand that the correlation between the percentage of Creek and percentage of households with 3 or more vehicles available does not imply a direct cause-and-effect relationship. It remains uncertain whether the presence of Creek influences an upward or downward trend in the level of percentage of households with 3 or more vehicles available within an area, or if Creek simply ended up residing in those areas with higher or lower levels of percentage of households with 3 or more vehicles available due to other factors.
Demographics Similar to Creek by 3 or more Vehicles in Household
In terms of 3 or more vehicles in household, the demographic groups most similar to Creek are British (21.9%, a difference of 0.030%), Alaskan Athabascan (21.9%, a difference of 0.18%), Bangladeshi (21.9%, a difference of 0.19%), Potawatomi (21.9%, a difference of 0.20%), and Portuguese (21.8%, a difference of 0.38%).
| Demographics | Rating | Rank | 3 or more Vehicles in Household |
| Fijians | 99.9 /100 | #62 | Exceptional 22.2% |
| Chickasaw | 99.9 /100 | #63 | Exceptional 22.2% |
| Immigrants from Taiwan | 99.9 /100 | #64 | Exceptional 22.1% |
| Pima | 99.9 /100 | #65 | Exceptional 22.0% |
| Northern Europeans | 99.9 /100 | #66 | Exceptional 22.0% |
| Alaskan Athabascans | 99.9 /100 | #67 | Exceptional 21.9% |
| British | 99.9 /100 | #68 | Exceptional 21.9% |
| Creek | 99.9 /100 | #69 | Exceptional 21.9% |
| Bangladeshis | 99.8 /100 | #70 | Exceptional 21.9% |
| Potawatomi | 99.8 /100 | #71 | Exceptional 21.9% |
| Portuguese | 99.8 /100 | #72 | Exceptional 21.8% |
| Salvadorans | 99.8 /100 | #73 | Exceptional 21.8% |
| Immigrants from Oceania | 99.8 /100 | #74 | Exceptional 21.8% |
| Japanese | 99.8 /100 | #75 | Exceptional 21.8% |
| Nonimmigrants | 99.8 /100 | #76 | Exceptional 21.8% |
Creek 3 or more Vehicles in Household Correlation Summary
| Measurement | Creek Data | 3 or more Vehicles in Household Data |
| Minimum | 0.037% | 4.1% |
| Maximum | 44.6% | 43.0% |
| Range | 44.5% | 38.9% |
| Mean | 11.5% | 24.9% |
| Median | 8.8% | 24.5% |
| Interquartile 25% (IQ1) | 4.3% | 20.0% |
| Interquartile 75% (IQ3) | 16.0% | 29.9% |
| Interquartile Range (IQR) | 11.7% | 9.9% |
| Standard Deviation (Sample) | 9.7% | 8.2% |
| Standard Deviation (Population) | 9.7% | 8.2% |
Correlation Details
| Creek Percentile | Sample Size | 3 or more Vehicles in Household |
[ 0.0% - 0.5% ] 0.037% | 165,676,188 | 19.1% |
[ 0.0% - 0.5% ] 0.31% | 5,449,749 | 24.0% |
[ 0.5% - 1.0% ] 0.57% | 2,578,153 | 22.9% |
[ 0.5% - 1.0% ] 0.75% | 1,135,579 | 23.7% |
[ 0.5% - 1.0% ] 1.00% | 554,993 | 26.2% |
[ 1.0% - 1.5% ] 1.21% | 567,462 | 24.7% |
[ 1.0% - 1.5% ] 1.48% | 423,663 | 24.3% |
[ 1.5% - 2.0% ] 1.69% | 543,018 | 18.3% |
[ 1.5% - 2.0% ] 1.93% | 433,319 | 22.7% |
[ 2.0% - 2.5% ] 2.14% | 87,585 | 26.3% |
[ 2.0% - 2.5% ] 2.33% | 127,266 | 21.9% |
[ 2.5% - 3.0% ] 2.55% | 104,272 | 23.3% |
[ 2.5% - 3.0% ] 2.76% | 150,540 | 26.2% |
[ 3.0% - 3.5% ] 3.02% | 24,270 | 24.0% |
[ 3.0% - 3.5% ] 3.19% | 63,433 | 30.5% |
[ 3.0% - 3.5% ] 3.44% | 49,223 | 22.8% |
[ 3.5% - 4.0% ] 3.70% | 23,138 | 26.7% |
[ 3.5% - 4.0% ] 3.88% | 61,014 | 14.8% |
[ 4.0% - 4.5% ] 4.12% | 9,988 | 31.3% |
[ 4.0% - 4.5% ] 4.31% | 31,427 | 18.8% |
[ 4.5% - 5.0% ] 4.59% | 34,437 | 23.2% |
[ 4.5% - 5.0% ] 4.71% | 24,499 | 32.1% |
[ 5.0% - 5.5% ] 5.05% | 752 | 41.0% |
[ 5.0% - 5.5% ] 5.23% | 8,038 | 35.2% |
[ 5.0% - 5.5% ] 5.44% | 23,323 | 20.0% |
[ 5.5% - 6.0% ] 5.64% | 2,996 | 29.4% |
[ 5.5% - 6.0% ] 5.94% | 758 | 23.2% |
[ 6.0% - 6.5% ] 6.07% | 1,120 | 30.7% |
[ 6.0% - 6.5% ] 6.34% | 1,262 | 29.9% |
[ 6.5% - 7.0% ] 6.59% | 42,642 | 25.4% |
[ 6.5% - 7.0% ] 6.74% | 21,074 | 17.0% |
[ 7.0% - 7.5% ] 7.03% | 20,318 | 25.9% |
[ 7.0% - 7.5% ] 7.17% | 17,879 | 25.1% |
[ 7.0% - 7.5% ] 7.48% | 15,295 | 25.7% |
[ 7.5% - 8.0% ] 7.64% | 7,093 | 35.6% |
[ 7.5% - 8.0% ] 7.94% | 17,750 | 14.8% |
[ 8.0% - 8.5% ] 8.17% | 4,602 | 31.4% |
[ 8.0% - 8.5% ] 8.33% | 1,393 | 38.3% |
[ 8.5% - 9.0% ] 8.62% | 2,934 | 40.1% |
[ 8.5% - 9.0% ] 8.89% | 3,128 | 38.0% |
[ 9.0% - 9.5% ] 9.02% | 1,286 | 13.2% |
[ 9.0% - 9.5% ] 9.49% | 2,572 | 22.6% |
[ 9.5% - 10.0% ] 9.69% | 227 | 21.4% |
[ 10.0% - 10.5% ] 10.13% | 9,131 | 27.4% |
[ 10.0% - 10.5% ] 10.41% | 3,181 | 17.9% |
[ 10.5% - 11.0% ] 10.53% | 247 | 39.1% |
[ 10.5% - 11.0% ] 10.73% | 5,639 | 20.8% |
[ 11.0% - 11.5% ] 11.18% | 152 | 11.7% |
[ 11.0% - 11.5% ] 11.41% | 368 | 35.9% |
[ 12.0% - 12.5% ] 12.33% | 15,212 | 20.9% |
[ 12.5% - 13.0% ] 12.80% | 1,086 | 18.1% |
[ 13.0% - 13.5% ] 13.11% | 11,366 | 17.8% |
[ 13.5% - 14.0% ] 13.70% | 9,396 | 26.8% |
[ 14.0% - 14.5% ] 14.21% | 183 | 38.6% |
[ 14.5% - 15.0% ] 14.52% | 124 | 27.3% |
[ 14.5% - 15.0% ] 14.75% | 373 | 29.1% |
[ 15.0% - 15.5% ] 15.46% | 2,419 | 27.1% |
[ 15.5% - 16.0% ] 15.65% | 3,048 | 20.8% |
[ 15.5% - 16.0% ] 15.98% | 2,828 | 28.2% |
[ 16.0% - 16.5% ] 16.27% | 375 | 30.0% |
[ 17.5% - 18.0% ] 17.65% | 119 | 39.5% |
[ 18.0% - 18.5% ] 18.10% | 210 | 23.3% |
[ 18.0% - 18.5% ] 18.29% | 328 | 19.4% |
[ 19.0% - 19.5% ] 19.18% | 245 | 37.6% |
[ 20.0% - 20.5% ] 20.36% | 894 | 30.7% |
[ 21.0% - 21.5% ] 21.15% | 6,000 | 25.9% |
[ 21.5% - 22.0% ] 21.76% | 763 | 14.3% |
[ 22.0% - 22.5% ] 22.22% | 54 | 28.6% |
[ 23.0% - 23.5% ] 23.27% | 739 | 26.2% |
[ 23.5% - 24.0% ] 23.66% | 3,373 | 20.9% |
[ 24.0% - 24.5% ] 24.41% | 1,815 | 18.4% |
[ 24.5% - 25.0% ] 24.86% | 1,070 | 23.2% |
[ 28.5% - 29.0% ] 28.91% | 128 | 11.3% |
[ 30.5% - 31.0% ] 30.85% | 2,480 | 8.8% |
[ 31.5% - 32.0% ] 31.77% | 447 | 8.6% |
[ 38.0% - 38.5% ] 38.25% | 1,498 | 4.1% |
[ 39.5% - 40.0% ] 39.89% | 371 | 43.0% |
[ 44.5% - 45.0% ] 44.58% | 83 | 10.0% |