Creek Disability Age Under 5
COMPARE
Creek
Select to Compare
Disability Age Under 5
Creek Disability Age Under 5
1.6%
DISABILITY | AGE UNDER 5
0.0/ 100
METRIC RATING
306th/ 347
METRIC RANK
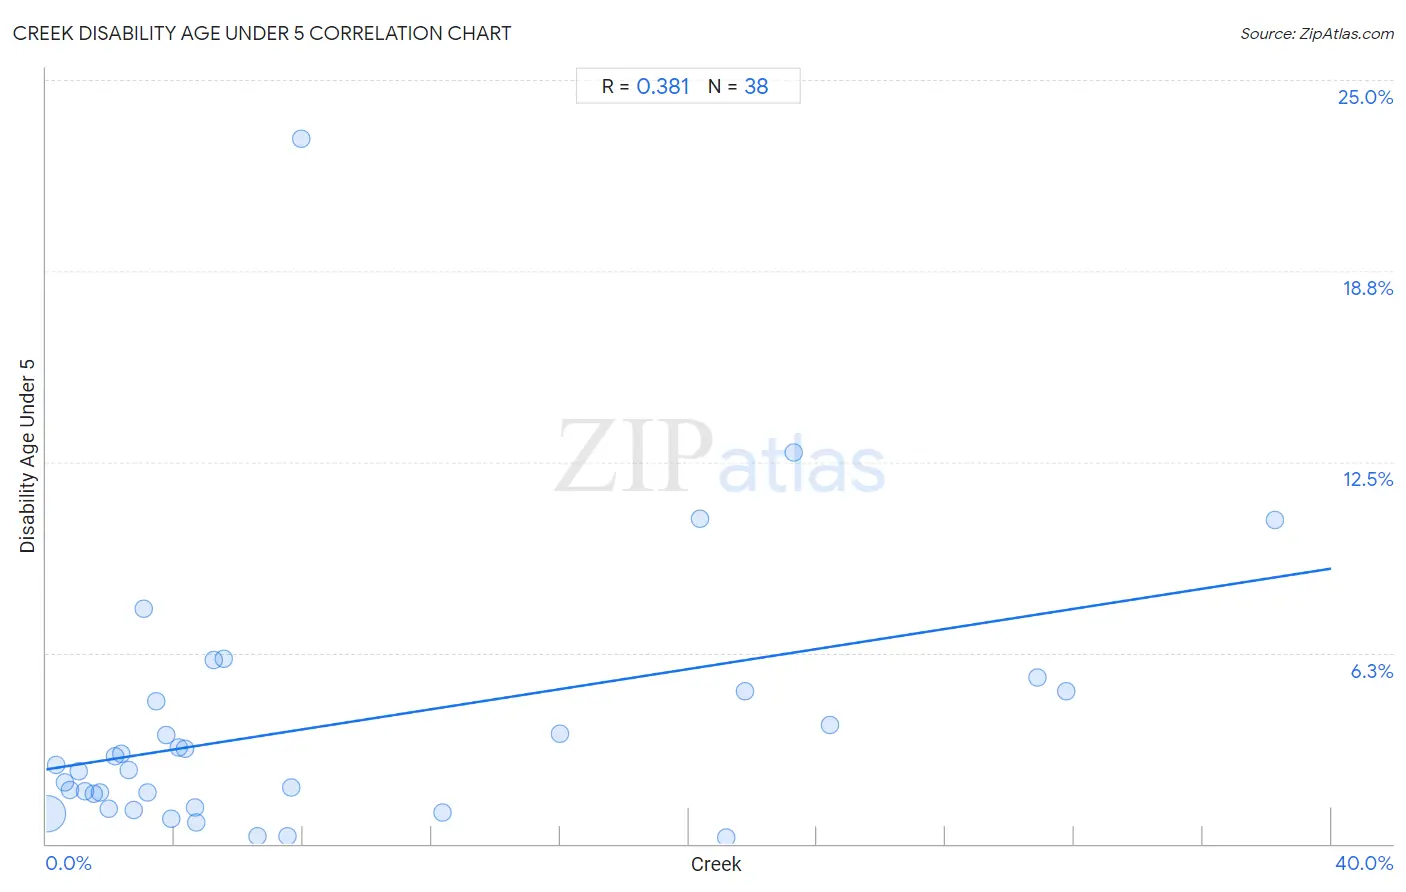
Creek Disability Age Under 5 Correlation Chart
The statistical analysis conducted on geographies consisting of 124,448,174 people shows a mild positive correlation between the proportion of Creek and percentage of population with a disability under the age of 5 in the United States with a correlation coefficient (R) of 0.381 and weighted average of 1.6%. On average, for every 1% (one percent) increase in Creek within a typical geography, there is an increase of 0.16% in percentage of population with a disability under the age of 5.
It is essential to understand that the correlation between the percentage of Creek and percentage of population with a disability under the age of 5 does not imply a direct cause-and-effect relationship. It remains uncertain whether the presence of Creek influences an upward or downward trend in the level of percentage of population with a disability under the age of 5 within an area, or if Creek simply ended up residing in those areas with higher or lower levels of percentage of population with a disability under the age of 5 due to other factors.
Demographics Similar to Creek by Disability Age Under 5
In terms of disability age under 5, the demographic groups most similar to Creek are Blackfeet (1.6%, a difference of 0.040%), Scottish (1.6%, a difference of 0.070%), Seminole (1.6%, a difference of 0.19%), Navajo (1.6%, a difference of 0.21%), and Swiss (1.6%, a difference of 0.83%).
| Demographics | Rating | Rank | Disability Age Under 5 |
| Portuguese | 0.0 /100 | #299 | Tragic 1.6% |
| Shoshone | 0.0 /100 | #300 | Tragic 1.6% |
| German Russians | 0.0 /100 | #301 | Tragic 1.6% |
| Welsh | 0.0 /100 | #302 | Tragic 1.6% |
| Swiss | 0.0 /100 | #303 | Tragic 1.6% |
| Seminole | 0.0 /100 | #304 | Tragic 1.6% |
| Blackfeet | 0.0 /100 | #305 | Tragic 1.6% |
| Creek | 0.0 /100 | #306 | Tragic 1.6% |
| Scottish | 0.0 /100 | #307 | Tragic 1.6% |
| Navajo | 0.0 /100 | #308 | Tragic 1.6% |
| Cape Verdeans | 0.0 /100 | #309 | Tragic 1.7% |
| Whites/Caucasians | 0.0 /100 | #310 | Tragic 1.7% |
| English | 0.0 /100 | #311 | Tragic 1.7% |
| Puerto Ricans | 0.0 /100 | #312 | Tragic 1.7% |
| Celtics | 0.0 /100 | #313 | Tragic 1.7% |
Creek Disability Age Under 5 Correlation Summary
| Measurement | Creek Data | Disability Age Under 5 Data |
| Minimum | 0.029% | 0.21% |
| Maximum | 38.3% | 23.1% |
| Range | 38.2% | 22.9% |
| Mean | 8.8% | 3.9% |
| Median | 4.2% | 2.5% |
| Interquartile 25% (IQ1) | 2.1% | 1.2% |
| Interquartile 75% (IQ3) | 12.3% | 5.0% |
| Interquartile Range (IQR) | 10.2% | 3.8% |
| Standard Deviation (Sample) | 10.2% | 4.4% |
| Standard Deviation (Population) | 10.0% | 4.3% |
Correlation Details
| Creek Percentile | Sample Size | Disability Age Under 5 |
[ 0.0% - 0.5% ] 0.029% | 118,865,831 | 0.99% |
[ 0.0% - 0.5% ] 0.30% | 1,447,501 | 2.6% |
[ 0.5% - 1.0% ] 0.58% | 1,522,802 | 2.0% |
[ 0.5% - 1.0% ] 0.75% | 560,789 | 1.8% |
[ 0.5% - 1.0% ] 0.99% | 245,704 | 2.4% |
[ 1.0% - 1.5% ] 1.21% | 257,549 | 1.7% |
[ 1.0% - 1.5% ] 1.49% | 179,435 | 1.7% |
[ 1.5% - 2.0% ] 1.69% | 500,649 | 1.7% |
[ 1.5% - 2.0% ] 1.94% | 310,686 | 1.1% |
[ 2.0% - 2.5% ] 2.15% | 38,363 | 2.9% |
[ 2.0% - 2.5% ] 2.32% | 84,117 | 2.9% |
[ 2.5% - 3.0% ] 2.56% | 61,569 | 2.4% |
[ 2.5% - 3.0% ] 2.74% | 98,624 | 1.1% |
[ 3.0% - 3.5% ] 3.04% | 15,946 | 7.7% |
[ 3.0% - 3.5% ] 3.16% | 42,056 | 1.7% |
[ 3.0% - 3.5% ] 3.41% | 3,991 | 4.7% |
[ 3.5% - 4.0% ] 3.74% | 4,701 | 3.6% |
[ 3.5% - 4.0% ] 3.89% | 53,385 | 0.82% |
[ 4.0% - 4.5% ] 4.12% | 5,412 | 3.1% |
[ 4.0% - 4.5% ] 4.32% | 30,173 | 3.1% |
[ 4.5% - 5.0% ] 4.63% | 19,416 | 1.2% |
[ 4.5% - 5.0% ] 4.68% | 15,955 | 0.68% |
[ 5.0% - 5.5% ] 5.23% | 5,122 | 6.0% |
[ 5.5% - 6.0% ] 5.53% | 524 | 6.1% |
[ 6.5% - 7.0% ] 6.56% | 31,578 | 0.23% |
[ 7.5% - 8.0% ] 7.51% | 9,977 | 0.26% |
[ 7.5% - 8.0% ] 7.62% | 3,439 | 1.9% |
[ 7.5% - 8.0% ] 7.92% | 404 | 23.1% |
[ 12.0% - 12.5% ] 12.33% | 15,212 | 1.0% |
[ 15.5% - 16.0% ] 15.98% | 2,828 | 3.6% |
[ 20.0% - 20.5% ] 20.36% | 894 | 10.6% |
[ 21.0% - 21.5% ] 21.15% | 6,000 | 0.21% |
[ 21.5% - 22.0% ] 21.76% | 763 | 5.0% |
[ 23.0% - 23.5% ] 23.27% | 739 | 12.8% |
[ 24.0% - 24.5% ] 24.40% | 1,615 | 3.9% |
[ 30.5% - 31.0% ] 30.85% | 2,480 | 5.4% |
[ 31.5% - 32.0% ] 31.77% | 447 | 5.0% |
[ 38.0% - 38.5% ] 38.25% | 1,498 | 10.6% |